資金費率扼殺你的槓桿:為什麼 PnL×50x 是虛構的

假設你優化了一個策略。回測顯示 PnL +55%,MaxDD -0.9%。你計算 MaxLev:。相乘:。兩年三千個百分點。你已經在腦海中挑選蘭博基尼了。
三個月後在實盤中,你的資金低於起始值。策略完全按照回測執行——相同的入場、相同的出場、相同的回撤。但你每天都在虧錢。持續不斷。
原因:資金費率。你的回測沒有考慮到的隱形費用——或者計算方式不正確。
資金費率如何運作
在加密貨幣交易所,永續合約(perpetual swaps)沒有到期日。為了使期貨價格錨定於現貨價格,交易所使用資金費率機制——多頭和空頭之間的定期支付。
Binance/Bybit 的機制:
- 資金費率每 8 小時支付一次(00:00、08:00、16:00 UTC)
- 資金費率由期貨價格與現貨價格之間的差異決定
- 如果資金費率為正——多頭向空頭支付
- 如果為負——空頭向多頭支付
- 典型費率:每 8 小時 (極端情況下可達 )
單次支付公式:
在槓桿 和資本 的情況下:
為什麼回測在槓桿問題上說謊
標準的 MaxLev(最大槓桿)指標是槓桿的理論上限,在此槓桿下回撤不超過目標水平:
該公式沒有考慮依賴於槓桿的成本。在 1 倍槓桿下,資金費率是微不足道的費用。在 58 倍——這是一場災難。
線性成本 vs 二次成本
交易手續費(maker/taker fees)是線性的——它們與交易量成正比,不依賴於槓桿。資金費率相對於倉位大小也是線性的,但按單位資本重新計算時,它們與槓桿成正比增長:
在持倉期 天和每天 3 次支付的情況下:
重新計算:考慮資金費率的策略示例
作為示例,考慮三個具有不同風險特徵的假設策略。參數:永續合約,25 個月測試期,典型資金費率為每 8 小時 0.01%。
原始結果(不考慮資金費率)
| 策略 | PnL | MaxDD | MaxLev | PnL@ML | 交易次數 | 持倉時間 |
|---|---|---|---|---|---|---|
| 策略 A | +55% | -0.9% | 55x | +3025% | ~500 | ~15% |
| 策略 B | +25% | -0.75% | 66x | +1650% | ~40 | ~5% |
| 策略 C | +300% | -17% | 3x | +900% | ~400 | ~45% |
計算資金費率成本
def funding_cost(
    leverage: float,
    trading_time_pct: float,
    test_days: int = 750,  # 25 个月
    funding_rate: float = 0.0001,  # 每 8 小时 0.01%
    payments_per_day: int = 3,
) -> float:
    """
    计算累计资金费率成本占资本的百分比。

    Returns:
        资金费率成本占初始资本的百分比
    """
    active_days = test_days * trading_time_pct
    daily_cost = funding_rate * payments_per_day * leverage
    total_cost = daily_cost * active_days
    return total_cost * 100  # 百分比
計算:
a_funding = funding_cost(55, 0.15, 750)

b_funding = funding_cost(66, 0.05, 750)

c_funding = funding_cost(3, 0.45, 750)
考慮資金費率後的結果
| 策略 | PnL@ML(無資金費率) | 資金費率成本 | PnL@ML(含資金費率) | 狀態 |
|---|---|---|---|---|
| 策略 A | +3025% | -185.6% | +2839% | 吞噬約 6% |
| 策略 B | +1650% | -74.3% | +1576% | 吞噬約 4.5% |
| 策略 C | +900% | -30.4% | +870% | 吞噬約 3% |
乍一看似乎可以接受:資金費率吞噬了最終 PnL@ML 的 3-6%。但這是平均資金費率。讓我們看看在費率升高時會發生什麼。
資金費率不是常數
典型的 0.01% 資金費率是中位數。實際上費率會波動:
| 市場階段 | 典型資金費率 | 55 倍下每 8 小時 | 55 倍下每天 |
|---|---|---|---|
| 平靜市場 | 0.005% | 0.275% | 0.825% |
| 正常 | 0.01% | 0.55% | 1.65% |
| 牛市趨勢 | 0.03% | 1.65% | 4.95% |
| 極端牛市 | 0.1% | 5.50% | 16.5% |
| 閃電拉昇 | 0.5% | 27.5% | — |
在 55 倍槓桿和牛市(0.03%)下:一天的多頭持倉僅資金費率就消耗資本的 4.95%。
每活躍日 PnL vs 每日資金費率
這是關鍵計算——策略日收益與日成本的對比:
a_pnl_per_day = 55 * 55 / 112.5  # PnL@ML / 活跃天数 = 26.9%/天


b_pnl_per_day = 25 * 66 / 37.5  # = 44.0%/天
從這些數字看,資金費率似乎不是關鍵。但這些是平均值。問題在別處。
真正的問題:回撤期間的資金費率

資金費率在倉位持有期間持續累積——包括回撤期。例如:0.9% 的最大回撤(策略 A)在 55 倍槓桿下變為:
這已經處於清算的邊緣。現在加上資金費率:
如果回撤持續 3 天,資金費率為 0.01%:
總計:——在標準 50% 維持保證金下已經爆倉。
考慮資金費率的安全槓桿公式
其中 Funding buffer 是典型回撤持續期間的預期資金費率:
這是一個遞迴方程(funding buffer 依賴於 )。解為:
def safe_leverage(
    max_dd_pct: float,
    target_dd_pct: float = 50.0,
    funding_rate: float = 0.0001,
    dd_duration_days: float = 3.0,
) -> float:
    """
    考虑回撤期间资金费率成本的安全杠杆。
    """
    denominator = max_dd_pct / 100 + funding_rate * 3 * dd_duration_days
    return target_dd_pct / 100 / denominator

a_safe = safe_leverage(0.9, 50.0, 0.0001, 3.0)

a_safe_high = safe_leverage(0.9, 50.0, 0.0003, 3.0)
**結論:**在典型資金費率下,策略 A 的安全槓桿是 50 倍,而非 55 倍。在資金費率升高時——42 倍。PnL@ML 的差異:
- 天真計算:
- 含資金費率(0.01%):
- 含資金費率(0.03%):
將資金費率實際整合到回測中
在回測中計入資金費率不是可選項——而是必須的。以下是最小化實現:
import pandas as pd
import numpy as np

def load_funding_rates(symbol: str) -> pd.DataFrame:
    """从数据仓库加载历史资金费率。"""
    path = f"warehouse/data/{symbol}/funding/"
    return df  # 列:[timestamp, rate]

def apply_funding_to_trades(trades, funding_rates, leverage: int = 1):
    """
    从每笔交易的 PnL 中扣除真实的资金费率成本。
    """
    for trade in trades:
        mask = (
            (funding_rates.index >= trade.entry_time) &
            (funding_rates.index <= trade.exit_time)
        )
        payments = funding_rates.loc[mask, 'rate']

        direction = 1 if trade.side == 'long' else -1
        total_funding = payments.sum() * direction * leverage

        trade.pnl_pct -= total_funding * 100

    return trades
在一個完善的回測引擎中,資金費率會自動載入並應用到每筆交易中。這提供了真實的畫面——通常比人們期望的更不樂觀。
現實的槓桿範圍
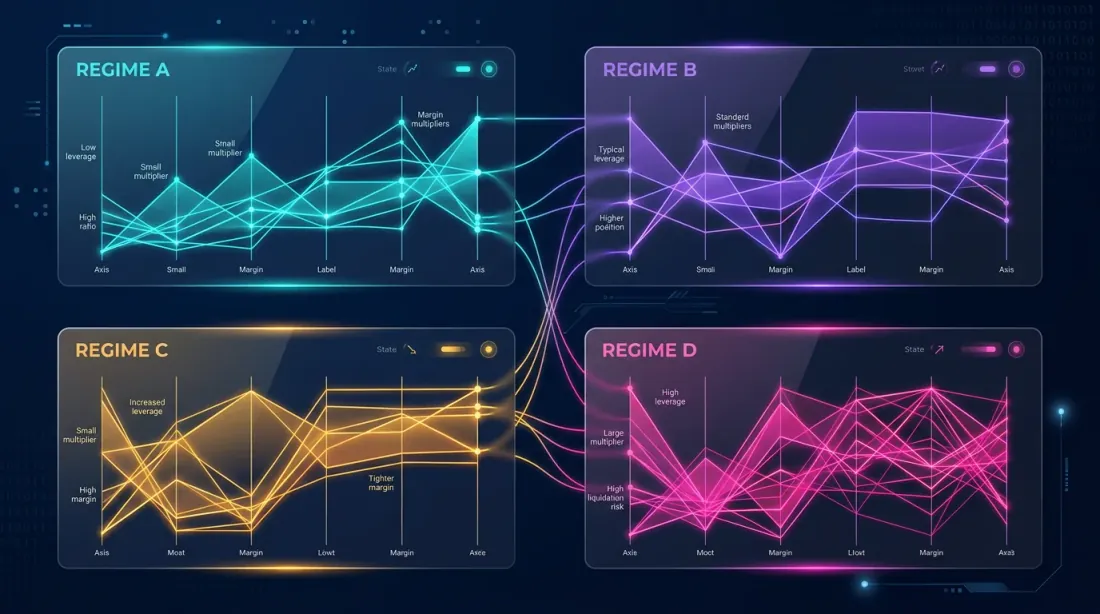
以下示例展示了資金費率在不同 MaxDD 水平下如何影響安全槓桿:
| 資金費率環境 | 平均費率 | DD=0.9% 時的 MaxLev | DD=17% 時的 MaxLev |
|---|---|---|---|
| 低(0.005%) | 0.005% | 53x | 3x |
| 典型(0.01%) | 0.01% | 50x | 3x |
| 升高(0.03%) | 0.03% | 42x | 3x |
| 高(0.05%) | 0.05% | 36x | 2x |
**關鍵發現:**對於低迴撤策略(策略 A、B),資金費率顯著降低有效槓桿。對於高回撤策略(策略 C),資金費率的影響最小——因為槓桿本來就限制在 3 倍。
最小化資金費率影響的策略
1. 對沖中性倉位
資金費率由期貨價格與現貨價格之間的差異決定。如果你的策略允許通過現貨進行對沖——資金費率就被中和了:
- 多頭期貨 + 空頭現貨 = 0 資金費率淨敞口
- 但是:在加密貨幣中做空現貨受限(需要保證金賬戶或借貸)
2. 轉移到資金費率較低的交易所
不同交易所對同一資產有不同的資金費率。監控資金費率套利本身就是一個獨立策略,在文章跨交易所資金費率套利中有詳細描述。
3. 入場時機選擇
資金費率在固定時間支付(00:00、08:00、16:00 UTC)。如果交易在支付前一分鐘平倉——資金費率不會被扣除。這是微觀最佳化,但在 58 倍槓桿下,一次跳過支付節省 0.58% 是可觀的。
4. 動態槓桿
不使用固定槓桿,而是使用自適應槓桿:
當資金費率升高時,槓桿自動降低,限制成本。
將資金費率整合到流水線中的建議
資金費率必須成為回測流水線的必要組成部分:
- 為每個交易對載入歷史資金費率
- 根據持倉期間的實際資金費率調整每筆交易
- 使用含 funding buffer 的公式計算 MaxLev
- 在報告中同時顯示兩個數字:不含資金費率的 PnL@ML 和含資金費率的 PnL@ML
**實用法則:**如果策略在 0.03% 資金費率下不再盈利(這在牛市中佔 20-30% 的時間)——它還沒有準備好在高槓杆下投入實盤。將槓桿降低到即使在最壞資金費率場景下策略仍然盈利的水平。
結論
資金費率是槓桿稅。就像真正的稅一樣,小額時不易察覺,大額時具有毀滅性。
三條規則:
-
**始終在計算 PnL@ML 時考慮資金費率。**不含資金費率的公式是營銷,不是交易。載入歷史資金費率,從每筆交易中扣除真實成本。
-
使用安全槓桿公式:
- **在 3 倍資金費率下測試。**如果策略在 0.03% 資金費率下仍然盈利(而不僅僅是 0.01%)——它是穩健的。如果不是——降低槓桿。
50-60 倍槓桿下漂亮的 PnL 數字是一種令人愉快的幻覺。資金費率是冰冷的現實。兩者之間的差距,就是回測和真實交易賬戶之間的距離。
關於高槓杆下回撤數學和波動率拖累的更多內容——請參閱我們的文章虧損與利潤的不對稱性。關於如何獲得經資金費率調整後結果的置信區間——回測的蒙特卡洛自助法。
有用連結
- Binance — Funding Rate History
- Binance — Introduction to Funding Rates
- Bybit — Understanding Funding Rates
- Deribit Insights — The Hidden Cost of Perpetual Swaps
- Lopez de Prado — Advances in Financial Machine Learning, Chapter 14: Backtest Statistics
- Kevin Davey — Building Winning Algorithmic Trading Systems: Transaction Costs
引用
@article{soloviov2026fundingratesleverage,
  author = {Soloviov, Eugen},
  title = {Funding Rates Kill Your Leverage: Why PnL×50x Is a Fiction},
  year = {2026},
  url = {https://marketmaker.cc/ru/blog/post/funding-rates-kill-leverage},
  version = {0.1.0},
  description = {Binance/Bybit 上的资金费率如何将高杠杆下漂亮的回测结果变成确定的亏损。公式、真实策略的重新计算,以及资金费率不吞噬利润的最大杠杆倍数。}
}
Authors
Trading-systems engineer
Trading-systems engineer building bots since 2017: cross-exchange arbitrage (connected up to 30 venues), cointegration-based pairs arbitrage across spot and futures, scalping, news and sentiment-driven strategies, trend algorithms, and portfolio management and balancing algorithms. Also builds sub-millisecond order execution, big-data warehouses, backtesting engines, AI agents, and trading interfaces (incl. open-source profitmaker.cc). Stack: JS/TS, Python, Rust/Zig/Go, DevOps, backend, frontend, architecture.