Tipos de Barras e Métodos de Agregação para Trading Algorítmico

Todo gráfico de candlestick que você já viu na Binance, TradingView ou na interface de qualquer exchange é construído da mesma forma: agregar negociações dentro de uma janela de tempo fixa — 1 minuto, 5 minutos, 1 hora — e produzir uma barra OHLCV. Isso é tão onipresente que a maioria dos traders nunca questiona. Mas, para o trading algorítmico, a escolha do tipo de barra e o método de agregação são duas decisões independentes — e a maioria dos sistemas as confunde.
Este artigo separa os dois eixos da construção de candles: que tipo de barra você constrói (17 tipos) e como você as agrega em timeframes superiores (3 métodos). A combinação resulta em 51 configurações possíveis, cada uma com propriedades diferentes para backtesting, trading ao vivo e geração de sinais.
Para uma introdução sobre como negociações brutas se tornam candles padrão, veja Trading Candles Demystified.
TL;DR
- A construção de candles tem dois eixos independentes: tipo de barra e método de agregação
- 17 tipos base de barras: tempo, tick, volume, dólar, Renko, range, volatilidade, Heikin-Ashi, Kagi, Line Break, P&F, tick imbalance (TIB), volume imbalance (VIB), run, CUSUM, entropia, delta
- 3 métodos de agregação: alinhado ao calendário, janela rolling, rolling adaptativo
- 17 × 3 = 51 combinações possíveis, cada uma com propriedades diferentes
- A maioria dos sistemas usa apenas uma combinação: barras de tempo alinhadas ao calendário. As outras 50 permanecem inexploradas.
- Recomendação prática: usar múltiplas combinações em camadas — barras de tempo rolling para sinais, barras de tempo de calendário para estrutura de mercado, barras orientadas por informação para microestrutura
Dois Eixos da Construção de Candles
A visão tradicional coloca todos os tipos de barras em uma lista plana: barras de tempo, barras de tick, barras de volume, Renko etc. Isso é enganoso. Na verdade, existem duas escolhas ortogonais:
Eixo 1 — Tipo Base de Barra (17 tipos): Como você decide quando uma nova barra fecha? Após um intervalo de tempo fixo? Após N negociações? Após um movimento de preço? Quando o conteúdo informacional muda? Isso determina o que significa "uma barra".
Eixo 2 — Método de Agregação (3 métodos): Como você compõe barras base em candles de timeframe superior? Alinhar aos limites do calendário (00:00, 01:00, ...)? Usar uma janela rolling das últimas N barras? Adaptar o tamanho da janela à volatilidade?
Esses dois eixos são independentes. Você pode ter:
- Barras de tick alinhadas ao calendário — agregar barras de tick que fecharam entre 14:00 e 14:59 em um único candle horário
- Barras de volume rolling — pegar as últimas 24 barras de volume, independentemente de quando fecharam
- Barras delta adaptativas — usar uma janela orientada pela volatilidade sobre barras delta
O "candle de 1 hora" padrão é apenas um ponto nesta matriz 17×3: barras de tempo + alinhamento de calendário. Qualquer outra combinação é uma alternativa que vale a pena considerar.
1. Barras de Tempo (Padrão)
 Densidade de informação desigual: limites rígidos de tempo tratam horas calmas de 200 negociações da mesma forma que horas de anúncios com 50.000 negociações.
O padrão. Uma nova barra se forma após um intervalo de tempo fixo: 1 minuto, 5 minutos, 1 hora. Toda exchange fornece isso nativamente.
Propriedades:
- Durante a sessão asiática (00:00–08:00 UTC), um candle de 1 hora pode conter 200 negociações. Durante um anúncio de listagem na Binance, essa mesma janela pode conter 50.000 negociações. Barras de tempo tratam ambos como equivalentes. Detectar tais picos de atividade é crítico para a proteção contra bots — veja Anomaly Detection for Trading Bots.
- Todos os participantes do mercado veem os mesmos limites de candle — um ponto Schelling. Isso torna as barras de tempo essenciais para analisar o comportamento coletivo.
- Indicadores calculados em candles parciais (após um reinício) produzem valores inutilizáveis.
from datetime import datetime

def time_until_valid_hourly_candle():
    """How long until the first complete hourly candle after restart."""
    now = datetime.utcnow()
    minutes_into_hour = now.minute
    seconds_into_minute = now.second

    wait_seconds = (60 - minutes_into_hour) * 60 - seconds_into_minute
    wait_seconds += 3600

    return wait_seconds
2–4. Barras Baseadas em Atividade
 Barras de tick, volume e dólar: três formas de deixar a participação do mercado — não o relógio — determinar os limites das barras.
Em vez de amostrar em intervalos de tempo fixos, amostra-se após uma quantidade fixa de atividade de mercado. Isso produz barras com "conteúdo informacional" aproximadamente igual, independentemente da hora do dia.
2. Barras de Tick
Uma nova barra se forma a cada N negociações (ticks). Durante alta atividade, as barras se formam rapidamente. Em períodos calmos, uma única barra pode se estender por horas.
from collections import deque
from dataclasses import dataclass

@dataclass
class OHLCV:
    timestamp: int
    open: float
    high: float
    low: float
    close: float
    volume: float

class TickBarGenerator:
    """
    Generates a new bar every `threshold` trades.
    Each bar contains equal number of market "opinions".
    """

    def __init__(self, threshold: int = 1000):
        self.threshold = threshold
        self.trades: list[tuple[float, float]] = []  # (price, qty)
        self.bars: list[OHLCV] = []

    def on_trade(self, timestamp: int, price: float, qty: float):
        self.trades.append((price, qty))

        if len(self.trades) >= self.threshold:
            self._close_bar(timestamp)

    def _close_bar(self, timestamp: int):
        prices = [t[0] for t in self.trades]
        volumes = [t[1] for t in self.trades]

        bar = OHLCV(
            timestamp=timestamp,
            open=prices[0],
            high=max(prices),
            low=min(prices),
            close=prices[-1],
            volume=sum(volumes),
        )
        self.bars.append(bar)
        self.trades = []
        return bar
Prós: Adapta-se naturalmente à atividade do mercado. Os retornos das barras de tick tendem a estar mais próximos de uma distribuição normal do que os retornos das barras de tempo — uma propriedade que melhora o desempenho de muitos modelos estatísticos.
Contras: Requer um fluxo de negociações brutas (não disponível em todos os provedores de dados históricos). O timing das barras é imprevisível — não é possível dizer "a próxima barra fechará em X".
3. Barras de Volume
Uma nova barra se forma depois que N contratos (ou moedas, em cripto) foram negociados. Similar às barras de tick, mas ponderada pelo tamanho da negociação — uma única negociação de 100 BTC contribui 100x mais do que uma negociação de 1 BTC.
class VolumeBarGenerator:
    """
    Generates a new bar every `threshold` units of volume.
    Normalizes for trade size: one large order ≠ one small order.
    """

    def __init__(self, threshold: float = 100.0):
        self.threshold = threshold
        self.accumulated_volume = 0.0
        self.trades: list[tuple[int, float, float]] = []  # (ts, price, qty)
        self.bars: list[OHLCV] = []

    def on_trade(self, timestamp: int, price: float, qty: float):
        self.trades.append((timestamp, price, qty))
        self.accumulated_volume += qty

        if self.accumulated_volume >= self.threshold:
            self._close_bar()

    def _close_bar(self):
        prices = [t[1] for t in self.trades]
        volumes = [t[2] for t in self.trades]

        bar = OHLCV(
            timestamp=self.trades[-1][0],
            open=prices[0],
            high=max(prices),
            low=min(prices),
            close=prices[-1],
            volume=sum(volumes),
        )
        self.bars.append(bar)
        self.accumulated_volume = 0.0
        self.trades = []
        return bar
4. Barras de Dólar
Uma nova barra se forma depois que um valor nocional fixo (em USD/USDT) foi negociado. A mais robusta das barras baseadas em atividade, porque normaliza tanto o número de negociações quanto o nível de preço.
Considere: se o ETH sobe de 4.000, vender 4.000, mas 10 ETH a $1.000. Barras de volume tratariam isso de forma diferente; barras de dólar tratam da mesma forma.
class DollarBarGenerator:
    """
    Generates a new bar every `threshold` dollars (USDT) of notional volume.
    Most robust normalization: independent of price level.

    Lopez de Prado (2018) recommends dollar bars as the default
    for most quantitative applications.
    """

    def __init__(self, threshold: float = 1_000_000.0):
        self.threshold = threshold
        self.accumulated_dollars = 0.0
        self.trades: list[tuple[int, float, float]] = []
        self.bars: list[OHLCV] = []

    def on_trade(self, timestamp: int, price: float, qty: float):
        self.trades.append((timestamp, price, qty))
        self.accumulated_dollars += price * qty

        if self.accumulated_dollars >= self.threshold:
            self._close_bar()

    def _close_bar(self):
        prices = [t[1] for t in self.trades]
        volumes = [t[2] for t in self.trades]

        bar = OHLCV(
            timestamp=self.trades[-1][0],
            open=prices[0],
            high=max(prices),
            low=min(prices),
            close=prices[-1],
            volume=sum(volumes),
        )
        self.bars.append(bar)
        self.accumulated_dollars = 0.0
        self.trades = []
        return bar
Escolhendo o Limiar
O limiar para barras baseadas em atividade deve produzir aproximadamente o mesmo número de barras por dia que as barras de tempo que você está substituindo. Para BTCUSDT na Binance:
| Tipo de Barra | Limiar Típico | ~Barras/Dia | TF Equivalente |
|---|---|---|---|
| Tick | 1.000 negociações | ~1.400 | ~1m |
| Tick | 50.000 negociações | ~28 | ~1h |
| Volume | 100 BTC | ~600 | ~2-3m |
| Volume | 2.400 BTC | ~25 | ~1h |
| Dólar | $1M | ~1.400 | ~1m |
| Dólar | $50M | ~28 | ~1h |
Esses números são aproximados e mudam drasticamente com o regime de mercado. Durante um rally ou um crash, barras baseadas em atividade produzirão 5-10x mais barras do que o normal — que é exatamente o objetivo.
5–7. Barras Baseadas em Preço
 Tijolos Renko, barras de range e barras de volatilidade: amostrar apenas quando o preço se move o suficiente para importar.
Barras baseadas em preço ignoram tanto o tempo quanto a atividade. Uma nova barra se forma somente quando o preço se move em um valor especificado. Isso naturalmente filtra o ruído lateral e destaca as tendências.
5. Barras Renko
Um novo "tijolo" Renko se forma quando o preço de fechamento se move pelo menos N unidades a partir do fechamento do tijolo anterior. Os tijolos são sempre do mesmo tamanho, criando uma representação visual limpa da direção da tendência.
class RenkoBarGenerator:
    """
    Generates Renko bricks based on price movement.

    Key property: during sideways movement, no new bricks form.
    During strong trends, bricks form rapidly.
    """

    def __init__(self, brick_size: float = 10.0):
        self.brick_size = brick_size
        self.bricks: list[dict] = []
        self.last_close: float | None = None

    def on_price(self, timestamp: int, price: float, volume: float = 0.0):
        if self.last_close is None:
            self.last_close = price
            return []

        new_bricks = []
        diff = price - self.last_close
        num_bricks = int(abs(diff) / self.brick_size)

        if num_bricks == 0:
            return []

        direction = 1 if diff > 0 else -1

        for i in range(num_bricks):
            brick_open = self.last_close
            brick_close = self.last_close + direction * self.brick_size

            brick = {
                'timestamp': timestamp,
                'open': brick_open,
                'high': max(brick_open, brick_close),
                'low': min(brick_open, brick_close),
                'close': brick_close,
                'volume': volume / num_bricks if num_bricks > 0 else 0,
                'direction': direction,
            }
            new_bricks.append(brick)
            self.last_close = brick_close

        self.bricks.extend(new_bricks)
        return new_bricks
O Renko dinâmico usa ATR (Average True Range) em vez de um tamanho de tijolo fixo, adaptando-se automaticamente à volatilidade.
6. Barras de Range
Cada barra tem um range máximo-mínimo fixo. Quando o range é excedido, a barra fecha e uma nova começa. Diferente do Renko, as barras de range incluem sombras e podem mostrar a volatilidade intra-barra.
class RangeBarGenerator:
    """
    Generates bars with a fixed high-low range.

    Difference from Renko: range bars show the full OHLC within
    the range, not just brick direction. More information-rich.
    """

    def __init__(self, range_size: float = 20.0):
        self.range_size = range_size
        self.current_high: float | None = None
        self.current_low: float | None = None
        self.current_open: float | None = None
        self.current_volume: float = 0.0
        self.current_start_ts: int = 0
        self.bars: list[OHLCV] = []

    def on_trade(self, timestamp: int, price: float, qty: float):
        if self.current_open is None:
            self.current_open = price
            self.current_high = price
            self.current_low = price
            self.current_start_ts = timestamp

        self.current_high = max(self.current_high, price)
        self.current_low = min(self.current_low, price)
        self.current_volume += qty

        if self.current_high - self.current_low >= self.range_size:
            bar = OHLCV(
                timestamp=timestamp,
                open=self.current_open,
                high=self.current_high,
                low=self.current_low,
                close=price,
                volume=self.current_volume,
            )
            self.bars.append(bar)

            self.current_open = price
            self.current_high = price
            self.current_low = price
            self.current_volume = 0.0
            self.current_start_ts = timestamp

            return bar

        return None
Diferença chave entre Renko e barras de Range: Renko rastreia apenas os preços de fechamento e mostra a direção; as barras de range rastreiam o range de preço completo e mostram a estrutura dentro da barra. Barras de range são geralmente mais úteis para trading algorítmico porque preservam a informação de máxima-mínima necessária para simulação de stop-loss e take-profit.
7. Barras de Volatilidade
Uma nova barra se forma quando a volatilidade intra-barra atinge um limiar dinâmico — por exemplo, um múltiplo do ATR recente. Diferente das barras de range (limiar fixo), as barras de volatilidade se adaptam às condições de mercado.
class VolatilityBarGenerator:
    """
    Generates bars when intra-bar volatility reaches a threshold.

    Similar to range bars, but the threshold adapts to market conditions
    using a rolling ATR measure. In calm markets, bars need less
    absolute movement to close; in volatile markets, more.
    """

    def __init__(
        self,
        atr_period: int = 14,
        atr_multiplier: float = 1.0,
        initial_threshold: float = 20.0,
    ):
        self.atr_period = atr_period
        self.atr_multiplier = atr_multiplier
        self.threshold = initial_threshold

        self.recent_ranges: list[float] = []
        self.current_open: float | None = None
        self.current_high: float | None = None
        self.current_low: float | None = None
        self.current_volume: float = 0.0
        self.bars: list[OHLCV] = []

    def on_trade(self, timestamp: int, price: float, qty: float):
        if self.current_open is None:
            self.current_open = price
            self.current_high = price
            self.current_low = price

        self.current_high = max(self.current_high, price)
        self.current_low = min(self.current_low, price)
        self.current_volume += qty

        intra_bar_range = self.current_high - self.current_low

        if intra_bar_range >= self.threshold:
            bar = OHLCV(
                timestamp=timestamp,
                open=self.current_open,
                high=self.current_high,
                low=self.current_low,
                close=price,
                volume=self.current_volume,
            )
            self.bars.append(bar)

            self.recent_ranges.append(intra_bar_range)
            if len(self.recent_ranges) > self.atr_period:
                self.recent_ranges = self.recent_ranges[-self.atr_period:]
            if len(self.recent_ranges) >= self.atr_period:
                avg_range = sum(self.recent_ranges) / len(self.recent_ranges)
                self.threshold = avg_range * self.atr_multiplier

            self.current_open = price
            self.current_high = price
            self.current_low = price
            self.current_volume = 0.0
            return bar

        return None
8. Heikin-Ashi (Transformação Suavizada)
 Heikin-Ashi: a média transforma candles ruidosos em sinais de tendência suaves — ao custo da informação exata de preço.
Heikin-Ashi (japonês para "barra média") não é um tipo de barra — é uma transformação que pode ser aplicada sobre qualquer tipo base de barra. Ela suaviza os candles calculando a média dos valores da barra atual e anterior:
- HA Close = (Open + High + Low + Close) / 4
- HA Open = (HA Open anterior + HA Close anterior) / 2
- HA High = max(High, HA Open, HA Close)
- HA Low = min(Low, HA Open, HA Close)
Tendências aparecem como sequências de candles da mesma cor sem sombras inferiores (tendência de alta) ou sem sombras superiores (tendência de baixa).
class HeikinAshiTransformer:
    """
    Transforms standard OHLCV candles into Heikin-Ashi candles.

    Can be applied on top of ANY bar type: time bars, volume bars,
    rolling bars, etc. It's a transformation, not a sampling method.

    WARNING: HA prices are synthetic — they don't represent real
    traded prices. Never use HA close for order placement or
    PnL calculation. Use HA only for signal generation, then
    execute at real prices.
    """

    def __init__(self):
        self.prev_ha_open: float | None = None
        self.prev_ha_close: float | None = None

    def transform(self, candle: OHLCV) -> OHLCV:
        ha_close = (candle.open + candle.high + candle.low + candle.close) / 4

        if self.prev_ha_open is None:
            ha_open = (candle.open + candle.close) / 2
        else:
            ha_open = (self.prev_ha_open + self.prev_ha_close) / 2

        ha_high = max(candle.high, ha_open, ha_close)
        ha_low = min(candle.low, ha_open, ha_close)

        self.prev_ha_open = ha_open
        self.prev_ha_close = ha_close

        return OHLCV(
            timestamp=candle.timestamp,
            open=ha_open,
            high=ha_high,
            low=ha_low,
            close=ha_close,
            volume=candle.volume,
        )

    def transform_series(self, candles: list[OHLCV]) -> list[OHLCV]:
        """Transform an entire series. Resets state first."""
        self.prev_ha_open = None
        self.prev_ha_close = None
        return [self.transform(c) for c in candles]


def ha_trend_signal(ha_candles: list[OHLCV], lookback: int = 3) -> int:
    """
    Simple HA trend signal.

    Returns:
        +1: bullish (N consecutive green HA candles with no lower wick)
        -1: bearish (N consecutive red HA candles with no upper wick)
         0: no clear trend
    """
    if len(ha_candles) < lookback:
        return 0

    recent = ha_candles[-lookback:]

    all_bullish = all(
        c.close > c.open and abs(c.low - min(c.open, c.close)) < 1e-10
        for c in recent
    )

    all_bearish = all(
        c.close < c.open and abs(c.high - max(c.open, c.close)) < 1e-10
        for c in recent
    )

    if all_bullish:
        return 1
    elif all_bearish:
        return -1
    return 0
Ressalva crítica para o backtesting: Os preços Heikin-Ashi são sintéticos. Se seu backtest usa o fechamento HA como preço de entrada, os resultados estarão errados. Use HA sempre apenas para geração de sinais e execute nos preços OHLC reais.
Quando HA é útil: Estratégias de seguimento de tendência que precisam de sinais limpos de "permanecer na posição". Aplique HA sobre qualquer tipo base de barra — barras de tempo, barras de volume, barras de dólar — para filtrar cruzamentos falsos.
Quando HA é prejudicial: Qualquer estratégia que precise de níveis de preço precisos — suporte/resistência, análise de livro de ofertas, PIQ (Position In Queue). A média destrói a informação exata de preço.
9–11. Gráficos de Reversão Japoneses
 Kagi, Line Break e Point & Figure: métodos de gráficos livres de tempo que focam puramente na estrutura do preço.
Estes são métodos tradicionais de gráficos japoneses (ao lado do Renko) que descartam completamente o tempo e focam na estrutura do preço.
9. Gráficos Kagi
Os gráficos Kagi consistem em linhas verticais que mudam de direção quando o preço se reverte em um valor especificado. As linhas mudam de espessura quando o preço rompe uma máxima anterior (grossa = "yang" = demanda) ou uma mínima anterior (fina = "yin" = oferta).
class KagiChartGenerator:
    """
    Generates Kagi chart lines based on price reversals.

    Unlike Renko (fixed brick size), Kagi tracks the actual magnitude
    of each move and changes line thickness at breakout points.

    Useful for identifying support/resistance breaks and
    supply/demand shifts without time noise.
    """

    def __init__(self, reversal_amount: float = 10.0):
        self.reversal_amount = reversal_amount
        self.lines: list[dict] = []
        self.current_direction: int = 0  # 1=up, -1=down
        self.current_price: float | None = None
        self.extreme_price: float | None = None
        self.prev_high: float | None = None
        self.prev_low: float | None = None
        self.line_type: str = 'yang'  # 'yang' (thick) or 'yin' (thin)

    def on_price(self, timestamp: int, price: float):
        if self.current_price is None:
            self.current_price = price
            self.extreme_price = price
            return None

        if self.current_direction == 0:
            if price - self.current_price >= self.reversal_amount:
                self.current_direction = 1
                self.extreme_price = price
            elif self.current_price - price >= self.reversal_amount:
                self.current_direction = -1
                self.extreme_price = price
            return None

        if self.current_direction == 1:
            if price > self.extreme_price:
                self.extreme_price = price
                if self.prev_high is not None and price > self.prev_high:
                    self.line_type = 'yang'
            elif self.extreme_price - price >= self.reversal_amount:
                line = {
                    'timestamp': timestamp,
                    'start': self.current_price,
                    'end': self.extreme_price,
                    'direction': 'up',
                    'type': self.line_type,
                }
                self.lines.append(line)
                self.prev_high = self.extreme_price
                self.current_price = self.extreme_price
                self.extreme_price = price
                self.current_direction = -1
                if self.prev_low is not None and price < self.prev_low:
                    self.line_type = 'yin'
                return line
        else:
            if price < self.extreme_price:
                self.extreme_price = price
                if self.prev_low is not None and price < self.prev_low:
                    self.line_type = 'yin'
            elif price - self.extreme_price >= self.reversal_amount:
                line = {
                    'timestamp': timestamp,
                    'start': self.current_price,
                    'end': self.extreme_price,
                    'direction': 'down',
                    'type': self.line_type,
                }
                self.lines.append(line)
                self.prev_low = self.extreme_price
                self.current_price = self.extreme_price
                self.extreme_price = price
                self.current_direction = 1
                if self.prev_high is not None and price > self.prev_high:
                    self.line_type = 'yang'
                return line

        return None
10. Gráficos Line Break
Os gráficos Line Break desenham uma nova linha (caixa) somente quando o preço de fechamento supera a máxima ou a mínima das N linhas anteriores (tipicamente 3). Nenhuma nova linha é desenhada se o preço permanecer dentro do range.
class LineBreakGenerator:
    """
    Generates Line Break bars (Three Line Break by default).

    A new bar is drawn only when the close exceeds the high or low
    of the last N bars. Filters out minor noise by requiring price
    to break through a multi-bar range.

    The 'N' parameter (line_count) controls sensitivity:
    - N=2: more sensitive, more bars, more noise
    - N=3: standard (Three Line Break)
    - N=4+: less sensitive, fewer bars, stronger signals
    """

    def __init__(self, line_count: int = 3):
        self.line_count = line_count
        self.lines: list[dict] = []

    def on_close(self, timestamp: int, close: float) -> dict | None:
        if not self.lines:
            self.lines.append({
                'timestamp': timestamp,
                'open': close,
                'close': close,
                'high': close,
                'low': close,
                'direction': 0,
            })
            return None

        lookback = self.lines[-self.line_count:] if len(self.lines) >= self.line_count else self.lines

        highest = max(l['high'] for l in lookback)
        lowest = min(l['low'] for l in lookback)
        last = self.lines[-1]

        new_line = None

        if close > highest:
            new_line = {
                'timestamp': timestamp,
                'open': last['close'],
                'close': close,
                'high': close,
                'low': last['close'],
                'direction': 1,
            }
        elif close < lowest:
            new_line = {
                'timestamp': timestamp,
                'open': last['close'],
                'close': close,
                'high': last['close'],
                'low': close,
                'direction': -1,
            }

        if new_line:
            self.lines.append(new_line)
            return new_line

        return None
11. Gráficos Point & Figure
Os gráficos Point & Figure (P&F) usam colunas de X (preços em alta) e O (preços em queda). A troca de coluna requer uma reversão de tipicamente 3 tamanhos de caixa. Um dos métodos mais antigos para filtrar ruído e identificar suporte/resistência.
class PointAndFigureGenerator:
    """
    Generates Point & Figure chart data.

    X column: price rising by box_size increments.
    O column: price falling by box_size increments.
    Column switch: requires reversal_boxes * box_size movement
    in the opposite direction.

    Classic setting: box_size based on ATR, reversal_boxes = 3.
    """

    def __init__(self, box_size: float = 10.0, reversal_boxes: int = 3):
        self.box_size = box_size
        self.reversal_boxes = reversal_boxes
        self.reversal_amount = box_size * reversal_boxes

        self.columns: list[dict] = []
        self.current_direction: int = 0
        self.current_top: float | None = None
        self.current_bottom: float | None = None

    def on_price(self, timestamp: int, price: float):
        if self.current_top is None:
            box_price = self._round_to_box(price)
            self.current_top = box_price
            self.current_bottom = box_price
            self.current_direction = 1
            return None

        events = []

        if self.current_direction == 1:
            while price >= self.current_top + self.box_size:
                self.current_top += self.box_size
                events.append(('X', self.current_top, timestamp))

            if price <= self.current_top - self.reversal_amount:
                col = {
                    'type': 'X',
                    'top': self.current_top,
                    'bottom': self.current_bottom,
                    'boxes': int((self.current_top - self.current_bottom) / self.box_size) + 1,
                    'timestamp': timestamp,
                }
                self.columns.append(col)
                self.current_direction = -1
                self.current_top = self.current_top - self.box_size
                self.current_bottom = self._round_to_box(price)
                events.append(('new_column', 'O', timestamp))

        else:
            while price <= self.current_bottom - self.box_size:
                self.current_bottom -= self.box_size
                events.append(('O', self.current_bottom, timestamp))

            if price >= self.current_bottom + self.reversal_amount:
                col = {
                    'type': 'O',
                    'top': self.current_top,
                    'bottom': self.current_bottom,
                    'boxes': int((self.current_top - self.current_bottom) / self.box_size) + 1,
                    'timestamp': timestamp,
                }
                self.columns.append(col)
                self.current_direction = 1
                self.current_bottom = self.current_bottom + self.box_size
                self.current_top = self._round_to_box(price)
                events.append(('new_column', 'X', timestamp))

        return events if events else None

    def _round_to_box(self, price: float) -> float:
        return round(price / self.box_size) * self.box_size
Kagi, Line Break e P&F no trading algorítmico: Usados principalmente para detecção de tendência de longo prazo e identificação de suporte/resistência. Como uma camada de filtro — "não aceitar sinais de compra quando o gráfico Kagi está em modo yin" — agregam valor ao alinhar as negociações com a estrutura macro.
12–14. Barras Orientadas por Informação
 Barras de imbalance, barras de run, filtros CUSUM e barras de entropia: amostrar quando o mercado nos diz que algo mudou.
A abordagem mais sofisticada, do livro Advances in Financial Machine Learning (2018) de Marcos Lopez de Prado. A ideia central: amostrar quando nova informação chega ao mercado, não em intervalos fixos.
12. Tick Imbalance Bars (TIB)
Se o mercado está em equilíbrio, negociações iniciadas por compradores e negociações iniciadas por vendedores devem se equilibrar aproximadamente. Quando o desequilíbrio excede nossa expectativa, algo mudou. Uma barra é amostrada nesse momento.
Cada negociação é classificada como iniciada pelo comprador (+1) ou pelo vendedor (-1) usando a regra do tick. Rastreamos o desequilíbrio acumulado θ e amostramos quando |θ| excede um limiar dinâmico.
class TickImbalanceBarGenerator:
    """
    Generates bars when the cumulative tick imbalance exceeds
    expected levels — i.e., when "new information" arrives.

    Based on Lopez de Prado (2018), Chapter 2.
    """

    def __init__(
        self,
        expected_ticks_init: int = 1000,
        ewma_window: int = 100,
        min_ticks: int = 100,
        max_ticks: int = 50000,
    ):
        self.expected_ticks_init = expected_ticks_init
        self.ewma_window = ewma_window
        self.min_ticks = min_ticks
        self.max_ticks = max_ticks

        self.theta = 0.0
        self.prev_price: float | None = None
        self.prev_sign = 1
        self.trades: list[tuple[int, float, float]] = []

        self.bar_lengths: list[int] = []
        self.imbalances: list[float] = []
        self.expected_ticks = float(expected_ticks_init)
        self.expected_imbalance = 0.0

        self.bars: list[OHLCV] = []

    def _tick_sign(self, price: float) -> int:
        """Classify trade as buy (+1) or sell (-1) using tick rule."""
        if self.prev_price is None:
            self.prev_price = price
            return 1

        if price > self.prev_price:
            sign = 1
        elif price < self.prev_price:
            sign = -1
        else:
            sign = self.prev_sign

        self.prev_price = price
        self.prev_sign = sign
        return sign

    def on_trade(self, timestamp: int, price: float, qty: float):
        sign = self._tick_sign(price)
        self.theta += sign
        self.trades.append((timestamp, price, qty))

        threshold = self.expected_ticks * abs(self.expected_imbalance)
        if threshold == 0:
            threshold = self.expected_ticks_init * 0.5

        if abs(self.theta) >= threshold and len(self.trades) >= self.min_ticks:
            return self._close_bar()

        if len(self.trades) >= self.max_ticks:
            return self._close_bar()

        return None

    def _close_bar(self):
        prices = [t[1] for t in self.trades]
        volumes = [t[2] for t in self.trades]

        bar = OHLCV(
            timestamp=self.trades[-1][0],
            open=prices[0],
            high=max(prices),
            low=min(prices),
            close=prices[-1],
            volume=sum(volumes),
        )
        self.bars.append(bar)

        self.bar_lengths.append(len(self.trades))
        self.imbalances.append(self.theta / len(self.trades))

        if len(self.bar_lengths) >= 2:
            alpha = 2.0 / (self.ewma_window + 1)
            self.expected_ticks = (
                alpha * self.bar_lengths[-1]
                + (1 - alpha) * self.expected_ticks
            )
            self.expected_ticks = max(
                self.min_ticks,
                min(self.max_ticks, self.expected_ticks)
            )
            self.expected_imbalance = (
                alpha * self.imbalances[-1]
                + (1 - alpha) * self.expected_imbalance
            )

        self.theta = 0.0
        self.trades = []
        return bar
13. Volume Imbalance Bars (VIB)
Extensão das TIBs: em vez de contar cada negociação como ±1, pondera-se pelo volume com sinal. Uma compra de 100 BTC contribui com +100, uma venda de 1 BTC contribui com -1. Captura grandes ordens informadas que podem ter sido divididas em muitas negociações pequenas.
class VolumeImbalanceBarGenerator:
    """
    Like TIBs, but uses signed volume instead of signed ticks.

    Captures the insight that a 100-BTC buy signal is 100x more
    informative than a 1-BTC buy signal.
    """

    def __init__(
        self,
        expected_ticks_init: int = 1000,
        ewma_window: int = 100,
    ):
        self.expected_ticks_init = expected_ticks_init
        self.ewma_window = ewma_window

        self.theta = 0.0
        self.prev_price: float | None = None
        self.prev_sign = 1
        self.trades: list[tuple[int, float, float]] = []

        self.bar_lengths: list[int] = []
        self.volume_imbalances: list[float] = []
        self.expected_ticks = float(expected_ticks_init)
        self.expected_vol_imbalance = 0.0

        self.bars: list[OHLCV] = []

    def _tick_sign(self, price: float) -> int:
        if self.prev_price is None:
            self.prev_price = price
            return 1
        if price > self.prev_price:
            sign = 1
        elif price < self.prev_price:
            sign = -1
        else:
            sign = self.prev_sign
        self.prev_price = price
        self.prev_sign = sign
        return sign

    def on_trade(self, timestamp: int, price: float, qty: float):
        sign = self._tick_sign(price)
        self.theta += sign * qty
        self.trades.append((timestamp, price, qty))

        threshold = self.expected_ticks * abs(self.expected_vol_imbalance)
        if threshold == 0:
            threshold = self.expected_ticks_init * 0.5

        if abs(self.theta) >= threshold and len(self.trades) >= 10:
            return self._close_bar()
        return None

    def _close_bar(self):
        prices = [t[1] for t in self.trades]
        volumes = [t[2] for t in self.trades]

        bar = OHLCV(
            timestamp=self.trades[-1][0],
            open=prices[0],
            high=max(prices),
            low=min(prices),
            close=prices[-1],
            volume=sum(volumes),
        )
        self.bars.append(bar)

        self.bar_lengths.append(len(self.trades))
        self.volume_imbalances.append(self.theta / len(self.trades))

        alpha = 2.0 / (self.ewma_window + 1)
        if len(self.bar_lengths) >= 2:
            self.expected_ticks = (
                alpha * self.bar_lengths[-1] + (1 - alpha) * self.expected_ticks
            )
            self.expected_vol_imbalance = (
                alpha * self.volume_imbalances[-1]
                + (1 - alpha) * self.expected_vol_imbalance
            )

        self.theta = 0.0
        self.trades = []
        return bar
O Problema da Explosão
Um problema conhecido das barras de imbalance: o limiar baseado em EWMA pode entrar em um loop de retroalimentação positiva. A solução: limitar com limites min_ticks e max_ticks.
self.expected_ticks = max(
    self.min_ticks,    # Floor: never less than 100 ticks
    min(
        self.max_ticks,  # Ceiling: never more than 50000 ticks
        new_expected_ticks
    )
)
14. Barras de Run
As barras de run rastreiam o comprimento da sequência direcional atual — a sequência consecutiva mais longa de compras ou vendas. Quando um grande trader informado divide uma ordem em muitas negociações pequenas, a sequência se torna incomumente longa. As barras de run detectam isso.
class TickRunBarGenerator:
    """
    Generates bars when the length of a directional run exceeds expectations.

    Based on Lopez de Prado (2018), Chapter 2.

    Difference from imbalance bars:
    - Imbalance bars track NET imbalance (buys minus sells)
    - Run bars track the MAXIMUM run length (consecutive buys OR sells)
    """

    def __init__(
        self,
        expected_ticks_init: int = 1000,
        ewma_window: int = 100,
        min_ticks: int = 100,
        max_ticks: int = 50000,
    ):
        self.expected_ticks_init = expected_ticks_init
        self.ewma_window = ewma_window
        self.min_ticks = min_ticks
        self.max_ticks = max_ticks

        self.prev_price: float | None = None
        self.prev_sign = 1
        self.trades: list[tuple[int, float, float]] = []

        self.buy_run = 0
        self.sell_run = 0
        self.max_buy_run = 0
        self.max_sell_run = 0

        self.bar_lengths: list[int] = []
        self.max_runs: list[float] = []
        self.expected_ticks = float(expected_ticks_init)
        self.expected_max_run = 0.0

        self.bars: list[OHLCV] = []

    def _tick_sign(self, price: float) -> int:
        if self.prev_price is None:
            self.prev_price = price
            return 1
        if price > self.prev_price:
            sign = 1
        elif price < self.prev_price:
            sign = -1
        else:
            sign = self.prev_sign
        self.prev_price = price
        self.prev_sign = sign
        return sign

    def on_trade(self, timestamp: int, price: float, qty: float):
        sign = self._tick_sign(price)
        self.trades.append((timestamp, price, qty))

        if sign == 1:
            self.buy_run += 1
            self.sell_run = 0
        else:
            self.sell_run += 1
            self.buy_run = 0

        self.max_buy_run = max(self.max_buy_run, self.buy_run)
        self.max_sell_run = max(self.max_sell_run, self.sell_run)

        theta = max(self.max_buy_run, self.max_sell_run)
        threshold = self.expected_ticks * self.expected_max_run if self.expected_max_run > 0 else self.expected_ticks_init * 0.3

        if theta >= threshold and len(self.trades) >= self.min_ticks:
            return self._close_bar()

        if len(self.trades) >= self.max_ticks:
            return self._close_bar()

        return None

    def _close_bar(self):
        prices = [t[1] for t in self.trades]
        volumes = [t[2] for t in self.trades]

        bar = OHLCV(
            timestamp=self.trades[-1][0],
            open=prices[0],
            high=max(prices),
            low=min(prices),
            close=prices[-1],
            volume=sum(volumes),
        )
        self.bars.append(bar)

        max_run = max(self.max_buy_run, self.max_sell_run) / len(self.trades)
        self.bar_lengths.append(len(self.trades))
        self.max_runs.append(max_run)

        alpha = 2.0 / (self.ewma_window + 1)
        if len(self.bar_lengths) >= 2:
            self.expected_ticks = alpha * self.bar_lengths[-1] + (1 - alpha) * self.expected_ticks
            self.expected_ticks = max(self.min_ticks, min(self.max_ticks, self.expected_ticks))
            self.expected_max_run = alpha * self.max_runs[-1] + (1 - alpha) * self.expected_max_run

        self.trades = []
        self.buy_run = 0
        self.sell_run = 0
        self.max_buy_run = 0
        self.max_sell_run = 0

        return bar
As barras de run podem ser estendidas para runs de volume e runs de dólar.
15. Barras de Filtro CUSUM
O filtro CUSUM (Cumulative Sum) determina quando amostrar rastreando retornos acumulados. Diferente das barras de imbalance (que funcionam com negociações brutas), o CUSUM pode ser aplicado a dados OHLCV de 1m existentes — não são necessários dados de tick.
class CUSUMFilterBarGenerator:
    """
    Symmetric CUSUM filter for event-based sampling.

    Based on Lopez de Prado (2018), Chapter 2.5.

    Key advantage over Bollinger Bands: CUSUM requires a FULL
    run of threshold magnitude before triggering. Bollinger Bands
    trigger repeatedly when price hovers near the band.

    Can be applied to 1m OHLCV data — no tick data required.
    """

    def __init__(self, threshold: float = 0.01):
        self.threshold = threshold
        self.s_pos = 0.0
        self.s_neg = 0.0
        self.prev_price: float | None = None
        self.buffer: list[OHLCV] = []
        self.bars: list[OHLCV] = []

    def on_candle_1m(self, candle: OHLCV) -> OHLCV | None:
        self.buffer.append(candle)

        if self.prev_price is None:
            self.prev_price = candle.close
            return None

        import math
        log_ret = math.log(candle.close / self.prev_price)
        self.prev_price = candle.close

        self.s_pos = max(0.0, self.s_pos + log_ret)
        self.s_neg = min(0.0, self.s_neg + log_ret)

        triggered = False

        if self.s_pos > self.threshold:
            self.s_pos = 0.0
            triggered = True

        if self.s_neg < -self.threshold:
            self.s_neg = 0.0
            triggered = True

        if triggered and len(self.buffer) >= 2:
            bars = self.buffer
            bar = OHLCV(
                timestamp=bars[-1].timestamp,
                open=bars[0].open,
                high=max(b.high for b in bars),
                low=min(b.low for b in bars),
                close=bars[-1].close,
                volume=sum(b.volume for b in bars),
            )
            self.bars.append(bar)
            self.buffer = []
            return bar

        return None
CUSUM + Método Triple Barrier: No framework de Lopez de Prado, os eventos CUSUM são usados como pontos de entrada para o método Triple Barrier — onde cada evento dispara uma negociação com barreiras de stop-loss, take-profit e expiração. Para uma validação robusta de tais estratégias orientadas por eventos, veja Walk-Forward Optimization e Monte Carlo Bootstrap for Backtesting.
16. Barras de Entropia
A abordagem mais elegante do ponto de vista teórico: amostrar quando o conteúdo informacional (entropia de Shannon) da série de preços intra-barra excede um limiar.
class EntropyBarGenerator:
    """
    Generates bars when the entropy of intra-bar returns exceeds
    a threshold.

    Based on Shannon's information theory: bars are sampled when
    "new information" arrives, measured as the entropy of the
    return distribution within the current bar.

    This is the most theoretically "pure" information-driven bar.
    """

    def __init__(
        self,
        entropy_threshold: float = 2.0,
        min_trades: int = 50,
        n_bins: int = 10,
    ):
        self.entropy_threshold = entropy_threshold
        self.min_trades = min_trades
        self.n_bins = n_bins
        self.trades: list[tuple[int, float, float]] = []
        self.bars: list[OHLCV] = []

    def on_trade(self, timestamp: int, price: float, qty: float):
        self.trades.append((timestamp, price, qty))

        if len(self.trades) < self.min_trades:
            return None

        entropy = self._compute_entropy()

        if entropy >= self.entropy_threshold:
            return self._close_bar()

        return None

    def _compute_entropy(self) -> float:
        import math

        prices = [t[1] for t in self.trades]
        if len(prices) < 2:
            return 0.0

        returns = [
            math.log(prices[i] / prices[i-1])
            for i in range(1, len(prices))
            if prices[i-1] > 0
        ]

        if not returns:
            return 0.0

        min_r = min(returns)
        max_r = max(returns)

        if max_r == min_r:
            return 0.0

        bin_width = (max_r - min_r) / self.n_bins
        bins = [0] * self.n_bins

        for r in returns:
            idx = min(int((r - min_r) / bin_width), self.n_bins - 1)
            bins[idx] += 1

        total = sum(bins)
        entropy = 0.0
        for count in bins:
            if count > 0:
                p = count / total
                entropy -= p * math.log2(p)

        return entropy

    def _close_bar(self):
        prices = [t[1] for t in self.trades]
        volumes = [t[2] for t in self.trades]

        bar = OHLCV(
            timestamp=self.trades[-1][0],
            open=prices[0],
            high=max(prices),
            low=min(prices),
            close=prices[-1],
            volume=sum(volumes),
        )
        self.bars.append(bar)
        self.trades = []
        return bar
Nota prática: As barras de entropia são computacionalmente caras e principalmente de interesse investigativo — mas para estratégias baseadas em ML, produzem características com melhores propriedades estatísticas porque cada barra contém aproximadamente a mesma quantidade de "informação".
17. Barras Delta (Order Flow)
 Delta cumulativo: medindo a força líquida de compradores e vendedores agressivos em tempo real.
As barras delta amostram com base no delta cumulativo — a diferença contínua entre volume de compra e volume de venda. Diferente das barras de imbalance (que usam sinais de tick ±1), as barras delta usam order flow real ponderado por volume.
class DeltaBarGenerator:
    """
    Generates bars based on cumulative order flow delta.

    Delta = Buy Volume - Sell Volume (classified by aggressor side).

    Requires trade-level data with side classification
    (available from Binance aggTrades, Bybit trades, etc.)
    """

    def __init__(self, threshold: float = 500.0):
        self.threshold = threshold
        self.cumulative_delta = 0.0
        self.trades: list[tuple[int, float, float, int]] = []
        self.bars: list[OHLCV] = []

    def on_trade(self, timestamp: int, price: float, qty: float, is_buyer_maker: bool):
        side = -1 if is_buyer_maker else 1
        signed_qty = side * qty

        self.cumulative_delta += signed_qty
        self.trades.append((timestamp, price, qty, side))

        if abs(self.cumulative_delta) >= self.threshold:
            return self._close_bar()

        return None

    def _close_bar(self):
        prices = [t[1] for t in self.trades]
        volumes = [t[2] for t in self.trades]

        bar = OHLCV(
            timestamp=self.trades[-1][0],
            open=prices[0],
            high=max(prices),
            low=min(prices),
            close=prices[-1],
            volume=sum(volumes),
        )
        bar.delta = self.cumulative_delta  # type: ignore
        bar.buy_volume = sum(t[2] for t in self.trades if t[3] == 1)  # type: ignore
        bar.sell_volume = sum(t[2] for t in self.trades if t[3] == -1)  # type: ignore

        self.bars.append(bar)
        self.cumulative_delta = 0.0
        self.trades = []
        return bar
Divergência de delta: Um dos sinais mais poderosos — o preço sobe enquanto o delta cumulativo é negativo (vendedores são agressivos, mas o preço ainda sobe, indicando absorção por compras a limite). Diretamente relevante para a abordagem de behavioral fingerprinting descrita no artigo Digital Fingerprint: Trader Identification. Para market makers que usam o modelo Avellaneda-Stoikov, as barras delta fornecem uma visão em tempo real do risco de inventário e da pressão do agressor.
 Um buffer circular de barras base: novos dados entram, dados antigos saem, e o candle agregado é sempre válido.
Os métodos de agregação determinam como as barras base são compostas em candles de timeframe superior (HTF). Eles são independentes do tipo de barra — você pode aplicar qualquer método de agregação a qualquer tipo base de barra.
Método A: Agregação Alinhada ao Calendário
Agregar todas as barras base que caem dentro de um limite de calendário fixo. O candle de "1 hora" cobre todas as barras de 14:00:00 a 14:59:59.
Propriedades:
- Todos os participantes do mercado veem os mesmos limites — essencial para análise de estrutura de mercado, suporte/resistência, gatilhos de PIQ
- Problema de cold start: candle parcial após reinício
- Natural para barras de tempo (é o que as exchanges fornecem nativamente)
- Também funciona para barras que não são de tempo: "todas as barras de volume que fecharam entre 14:00 e 15:00" = um candle horário alinhado ao calendário a partir de barras de volume
Método B: Agregação por Janela Rolling
Agregar as últimas N barras base fechadas, recalculadas a cada nova barra. Um candle rolling de "1 hora" = as últimas 60 barras de tempo de 1 minuto fechadas, atualizado a cada minuto.
A unidade atômica é a barra base fechada. Essa escolha de design proporciona:
- Sem cold start. Após N barras, o candle é válido. Sem ruído de candles parciais.
- Paridade de backtest. Se o trading ao vivo usa a mesma unidade atômica que o motor de backtest, os sinais são idênticos.
- Validação simples. Uma regra:
if buffer not full: skip.
import numpy as np

class RollingCandleAggregator:
    """
    Produces rolling higher-timeframe candles from closed base bars.

    Works with ANY bar type: time bars, tick bars, volume bars,
    dollar bars, delta bars — anything that produces OHLCV output.

    Example: RollingCandleAggregator(window=60) with 1m time bars
    produces a "1h" candle updated every minute.

    Example: RollingCandleAggregator(window=24) with volume bars
    produces a candle spanning the last 24 volume bars.
    """

    def __init__(self, window: int):
        self.window = window
        self.buffer: deque[OHLCV] = deque(maxlen=window)

    def push(self, bar: OHLCV) -> OHLCV | None:
        """
        Add a closed base bar. Returns aggregated candle
        only when buffer is full (= candle is valid).
        """
        self.buffer.append(bar)

        if len(self.buffer) < self.window:
            return None

        return self._aggregate()

    def _aggregate(self) -> OHLCV:
        bars = list(self.buffer)
        return OHLCV(
            timestamp=bars[-1].timestamp,
            open=bars[0].open,
            high=max(b.high for b in bars),
            low=min(b.low for b in bars),
            close=bars[-1].close,
            volume=sum(b.volume for b in bars),
        )

    @property
    def is_valid(self) -> bool:
        return len(self.buffer) == self.window
Compromisso de deslocamento de fase: Candles rolling fecham às :37 se você começou às :37, não às :00 como todos os outros. Isso importa para estratégias que dependem de níveis visíveis à multidão. A solução: usar ambos — calendário para estrutura de mercado, rolling para sinais.
Método C: Agregação Rolling Adaptativa
Como o rolling, mas o tamanho da janela se adapta à volatilidade atual. Mercados calmos → janela mais larga (mais suavização). Mercados voláteis → janela mais estreita (reação mais rápida).
class AdaptiveRollingAggregator:
    """
    Rolling window where the window size adapts to volatility.

    Works with any base bar type. Uses ATR of recent bars
    as the volatility measure.

    Low volatility → wider window (more smoothing, fewer signals)
    High volatility → narrower window (faster reaction)
    """

    def __init__(
        self,
        base_window: int = 60,
        min_window: int = 15,
        max_window: int = 240,
        atr_period: int = 14,
        atr_base: float | None = None,
    ):
        self.base_window = base_window
        self.min_window = min_window
        self.max_window = max_window
        self.atr_period = atr_period
        self.atr_base = atr_base

        self.all_candles: deque[OHLCV] = deque(maxlen=max_window)
        self.atr_values: deque[float] = deque(maxlen=atr_period * 2)
        self.current_window = base_window

    def push(self, bar: OHLCV) -> OHLCV | None:
        self.all_candles.append(bar)

        tr = bar.high - bar.low
        self.atr_values.append(tr)

        if len(self.atr_values) < self.atr_period:
            return None

        current_atr = sum(list(self.atr_values)[-self.atr_period:]) / self.atr_period

        if self.atr_base is None and len(self.atr_values) >= self.atr_period * 2:
            self.atr_base = sum(self.atr_values) / len(self.atr_values)

        if self.atr_base is None or self.atr_base == 0:
            return None

        vol_ratio = current_atr / self.atr_base
        self.current_window = int(self.base_window / vol_ratio)
        self.current_window = max(self.min_window, min(self.max_window, self.current_window))

        if len(self.all_candles) < self.current_window:
            return None

        bars = list(self.all_candles)[-self.current_window:]
        return OHLCV(
            timestamp=bars[-1].timestamp,
            open=bars[0].open,
            high=max(b.high for b in bars),
            low=min(b.low for b in bars),
            close=bars[-1].close,
            volume=sum(b.volume for b in bars),
        )
Cada tipo base de barra pode ser combinado com cada método de agregação. Algumas combinações são padrão (barras de tempo alinhadas ao calendário = o que as exchanges fornecem), outras são exóticas mas poderosas.
Exemplos de Combinações
| Tipo Base de Barra | Calendário | Rolling | Adaptativo |
|---|---|---|---|
| Tempo | Candles padrão de exchange | HTF sempre válido, sem cold start | Timeframe adaptativo à volatilidade |
| Volume | "Todas as barras de volume desta hora" | Últimas 24 barras de volume | Janela mais larga em mercados calmos |
| Dólar | Agregado horário de barras de dólar | Últimas N barras de dólar | Janelas de dólar adaptativas |
| Tick Imbalance | Agregado horário de imbalance | Últimos N eventos de imbalance | Reação rápida em regimes voláteis |
| Delta | Order flow líquido por hora | Snapshot delta rolling | Janela de fluxo adaptativa |
| Renko | "Tijolos desta hora" | Últimos N tijolos | Contagem adaptativa de tijolos |
Motor Híbrido: Calendário + Rolling
Na prática, você vai querer ter tanto agregação de calendário quanto de rolling simultaneamente. A sobrecarga de memória é insignificante — dois buffers deque por timeframe por símbolo.
class HybridCandleEngine:
    """
    Maintains both calendar-aligned and rolling candles
    for any base bar type.

    Calendar candles: for market structure, support/resistance, PIQ.
    Rolling candles: for indicators, signal generation, entries/exits.
    """

    def __init__(self):
        self.rolling = {
            '1h': RollingCandleAggregator(60),
            '4h': RollingCandleAggregator(240),
        }
        self.calendar: dict[str, list[OHLCV]] = {
            '1h': [],
            '4h': [],
        }
        self._calendar_buffer: dict[str, list[OHLCV]] = {
            '1h': [],
            '4h': [],
        }

    def on_bar(self, bar: OHLCV):
        """Process any base bar type — time, volume, tick, delta, etc."""
        rolling_results = {}
        for tf, agg in self.rolling.items():
            rolling_results[tf] = agg.push(bar)

        self._update_calendar(bar)

        return rolling_results

    def _update_calendar(self, bar: OHLCV):
        from datetime import datetime
        ts = datetime.utcfromtimestamp(bar.timestamp)

        for tf, minutes in [('1h', 60), ('4h', 240)]:
            self._calendar_buffer[tf].append(bar)

            total_minutes = ts.hour * 60 + ts.minute
            if (total_minutes + 1) % minutes == 0:
                bars = self._calendar_buffer[tf]
                if bars:
                    agg = OHLCV(
                        timestamp=bars[-1].timestamp,
                        open=bars[0].open,
                        high=max(b.high for b in bars),
                        low=min(b.low for b in bars),
                        close=bars[-1].close,
                        volume=sum(b.volume for b in bars),
                    )
                    self.calendar[tf].append(agg)
                    self._calendar_buffer[tf] = []
Híbrido Tempo-Volume: Calendário com Divisões de Volume
Uma variante especial de agregação: candles alinhados ao calendário que fecham antecipadamente quando o volume excede um limiar. Mantém a sincronização temporal enquanto se adapta a picos de atividade.
class TimeVolumeHybridGenerator:
    """
    Calendar-aligned candles that split when volume spikes.

    Rule: close the candle at the calendar boundary OR when
    accumulated volume exceeds vol_threshold, whichever comes first.

    Works with any base bar type — the volume trigger adds an
    extra split dimension on top of calendar alignment.
    """

    def __init__(
        self,
        interval_minutes: int = 60,
        vol_threshold: float = 5000.0,
    ):
        self.interval_minutes = interval_minutes
        self.vol_threshold = vol_threshold

        self.buffer: list[OHLCV] = []
        self.accumulated_volume = 0.0
        self.bars: list[OHLCV] = []

    def on_bar(self, bar: OHLCV) -> OHLCV | None:
        self.buffer.append(bar)
        self.accumulated_volume += bar.volume

        from datetime import datetime
        ts = datetime.utcfromtimestamp(bar.timestamp)
        total_minutes = ts.hour * 60 + ts.minute
        at_boundary = (total_minutes + 1) % self.interval_minutes == 0

        vol_spike = self.accumulated_volume >= self.vol_threshold

        if at_boundary or vol_spike:
            return self._close_bar(split_reason='volume' if vol_spike else 'time')

        return None

    def _close_bar(self, split_reason: str) -> OHLCV:
        bars = self.buffer
        bar = OHLCV(
            timestamp=bars[-1].timestamp,
            open=bars[0].open,
            high=max(b.high for b in bars),
            low=min(b.low for b in bars),
            close=bars[-1].close,
            volume=sum(b.volume for b in bars),
        )
        bar.split_reason = split_reason  # type: ignore
        bar.num_bars = len(bars)  # type: ignore

        self.bars.append(bar)
        self.buffer = []
        self.accumulated_volume = 0.0
        return bar
Agregação Prática: Pré-carregamento em Cascata
 Pré-carregamento em cascata: compor candles diários a partir dos horários, e os horários a partir dos de minuto — contornando limites de API.
As exchanges limitam a quantidade de dados históricos que fornecem. A Binance dá ~1000 candles por requisição REST, a OKX limita a 300. Se você precisa de um candle rolling 1D (1440 minutos), nem sempre é possível obter histórico de 1m suficiente. Para o streaming em tempo real de negociações e livros de ofertas via WebSocket, veja CCXT Pro WebSocket Methods.
A solução: agregação em cascata — construir timeframes superiores a partir da maior resolução disponível em cada nível, e então uni-los.
Rolling 1W candle:
├── 6 completed 1D candles ← fetch from REST /klines?interval=1d
├── 1 partial day:
│   ├── 23 completed 1h candles ← fetch from REST /klines?interval=1h
│   └── 1 partial hour:
│       └── N completed 1m candles ← fetch from REST /klines?interval=1m
└── Live: each new closed 1m candle updates the entire chain
Isso funciona porque a agregação OHLCV é componível: a máxima de um candle 1D é o máximo de 24 máximas 1h, que é o máximo de 1440 máximas 1m.
Limites Multi-Exchange
| Exchange | Máx. Candles 1m | Máx. Candles 1h | Intervalos Notáveis |
|---|---|---|---|
| Binance | 1.000 | 1.000 | 1m–1M, faixa completa |
| Bybit | 1.000 | 1.000 | 1–720, D/W/M |
| OKX | 300 | 300 | 1m–1M (mais restritivo) |
| Gate.io | 1.000 | 1.000 | 10s–30d |
Verificação de Consistência da Agregação
O candle de 1h de uma API REST pode não corresponder ao que você calcularia a partir de 60 candles de 1m. Sempre valide:
def validate_aggregation(
    candle_htf: OHLCV,
    candles_ltf: list[OHLCV],
    tolerance_pct: float = 0.001,
) -> dict[str, bool]:
    agg = OHLCV(
        timestamp=candles_ltf[-1].timestamp,
        open=candles_ltf[0].open,
        high=max(c.high for c in candles_ltf),
        low=min(c.low for c in candles_ltf),
        close=candles_ltf[-1].close,
        volume=sum(c.volume for c in candles_ltf),
    )

    def close_enough(a: float, b: float) -> bool:
        if a == 0 and b == 0:
            return True
        return abs(a - b) / max(abs(a), abs(b)) < tolerance_pct

    return {
        'open': close_enough(candle_htf.open, agg.open),
        'high': close_enough(candle_htf.high, agg.high),
        'low': close_enough(candle_htf.low, agg.low),
        'close': close_enough(candle_htf.close, agg.close),
        'volume': close_enough(candle_htf.volume, agg.volume),
    }
Se a validação falhar consistentemente, sempre agregue você mesmo a partir de 1m — nunca confie no candle HTF da exchange para a paridade de backtest.
Matriz Comparativa
Eixo 1: Tipos Base de Barras
| # | Tipo de Barra | Gatilho | Requer Dados de Tick | Melhor Para |
|---|---|---|---|---|
| 1 | Tempo | Intervalo fixo | Não | Estrutura de mercado, comportamento coletivo |
| 2 | Tick | N negociações | Sim | Características de ML, amostragem de opinião equitativa |
| 3 | Volume | N unidades negociadas | Sim | Análise de atividade normalizada |
| 4 | Dólar | N $ nocional | Sim | Comparação entre ativos |
| 5 | Renko | Preço ± N unidades | Não | Seguimento de tendência, filtragem de ruído |
| 6 | Range | Máxima-Mínima ≥ N | Sim | Detecção de breakouts |
| 7 | Volatilidade | Range adaptativo | Sim | Análise adaptativa ao regime |
| 8 | Heikin-Ashi | Transformação | Não | Confirmação de tendência (preços sintéticos!) |
| 9 | Kagi | Reversão de preço | Não | Estrutura de oferta/demanda |
| 10 | Line Break | Breakout de N linhas | Não | Filtro de tendência macro |
| 11 | Point & Figure | Caixa + reversão | Não | Mapeamento de suporte/resistência |
| 12 | TIB | Imbalance de tick | Sim | Detecção de fluxo informado |
| 13 | VIB | Imbalance de volume | Sim | Detecção de grandes ordens |
| 14 | Run | Comprimento da sequência | Sim | Detecção de fracionamento de ordens |
| 15 | CUSUM | Retorno acumulado | Não (fechamentos de 1m) | Eventos de ruptura estrutural |
| 16 | Entropia | Entropia de Shannon | Sim | Pesquisa em ML, pureza de características |
| 17 | Delta | Delta de order flow | Sim (aggTrades) | Análise de fluxo agressor |
Eixo 2: Métodos de Agregação
| Método | Alinhamento | Cold Start | Deslocamento de Fase | Melhor Para |
|---|---|---|---|---|
| Calendário | Relógio de parede | Risco de barra parcial | Nenhum (alinhado à multidão) | Estrutura de mercado, PIQ, S/R |
| Rolling | N barras | Nenhum (após warmup) | Sim (deslocado de :00) | Indicadores, sinais |
| Adaptativo | N orientado por volatilidade | Após calibração ATR | Sim | Estratégias adaptativas à volatilidade |
Recomendações Práticas
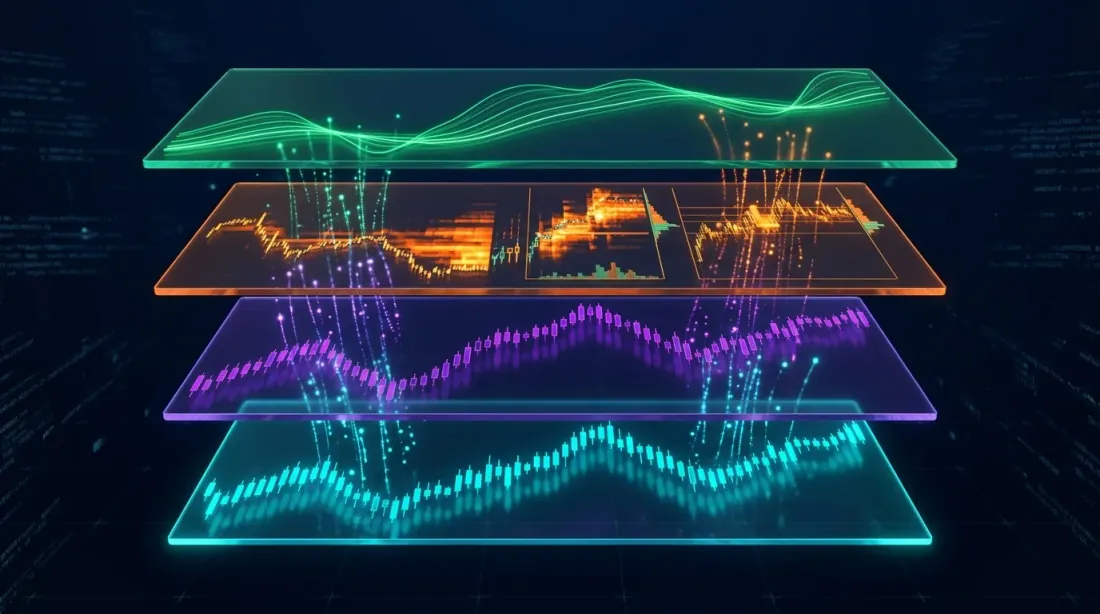 Arquitetura de candles de quatro camadas: sinais rolling, estrutura de calendário, fluxo de microestrutura e filtros de tendência.
Se o seu motor de backtest funciona com dados OHLCV de 1m:
- Barras de tempo rolling — a atualização mais simples. Sem dados adicionais. Elimina o cold start.
- Barras de tempo híbridas (rolling + calendário) — calendário para estrutura de mercado, rolling para sinais.
- Filtro CUSUM — funciona com fechamentos de 1m, sem dados de tick. "Algo se moveu o suficiente para ser interessante."
Se você tem dados de tick/negociação:
- Barras de dólar + rolling — o padrão recomendado pela literatura de finanças quantitativas.
- Barras de volume imbalance + rolling — detecta fluxo informado, amostra com mais frequência durante eventos significativos.
- Barras delta + calendário — se você tem classificação do lado agressor, a visão mais direta de quem está empurrando o mercado.
Como filtros (aplicar Heikin-Ashi ou Line Break sobre qualquer combinação de base+agregação):
- Heikin-Ashi sobre barras de volume rolling — sinais de tendência limpos sobre dados normalizados por atividade.
- Line Break/Kagi sobre barras de calendário diárias — filtro de tendência macro.
Para o Marketmaker.cc especificamente — uma abordagem em camadas:
- Camada 1 (sinais): Agregação rolling de barras de tempo para indicadores e sinais de entrada/saída. Sem cold start, paridade de backtest perfeita.
- Camada 2 (estrutura de mercado): Barras de tempo alinhadas ao calendário para suporte/resistência, análise de fechamentos horários e gatilhos de PIQ.
- Camada 3 (microestrutura): Barras de volume imbalance + barras delta a partir do fluxo de negociações brutas para detectar fluxo informado, fracionamento de ordens e antecipar grandes movimentos. Veja também Digital Fingerprint: Trader Identification para reconhecimento de padrões comportamentais em dados de order flow.
- Camada 4 (filtro de tendência): Transformação Heikin-Ashi sobre barras rolling, ou Line Break sobre fechamentos de calendário de 4h, para manter os sinais alinhados com a direção macro.
Conclusão
A construção de candles não é uma escolha única — são duas decisões independentes:
-
Que tipo de barra? O tempo captura intervalos de relógio. A atividade (tick, volume, dólar) captura a participação do mercado. O preço (Renko, range, volatilidade) captura movimentos. A informação (imbalance, runs, CUSUM, entropia) captura a chegada de nova informação. O order flow (delta) captura a pressão agressiva.
-
Como agregar em timeframes superiores? O calendário se alinha com a multidão. O rolling elimina o cold start. O adaptativo reage à volatilidade.
O "candle de 1 hora da Binance" padrão é apenas uma célula em uma matriz 17×3. As outras 50 combinações estão disponíveis para quem estiver disposto a implementá-las. Para um sistema em produção, a resposta é "escolher a combinação certa para cada camada do seu motor de decisão".
A unidade atômica — a barra base fechada — continua sendo o fundamento. Tudo o mais é agregação.
Para mais sobre precisão de backtest com dados de granularidade fina, veja Adaptive Drill-Down: Backtest with Variable Granularity. Sobre o impacto do pré-cálculo de indicadores em estratégias multi-timeframe, veja Aggregated Parquet Cache.
Links Úteis
- Lopez de Prado — Advances in Financial Machine Learning (2018)
- Easley, Lopez de Prado, O'Hara — The Volume Clock: Insights into the High Frequency Paradigm (2012)
- mlfinlab — biblioteca Python que implementa barras orientadas por informação
- Binance — Dados Históricos de Mercado
- Apache Parquet — formato de armazenamento colunar
Citação
@article{soloviov2026bartypes,
  author = {Soloviov, Eugen},
  title = {Bar Types and Aggregation Methods for Algorithmic Trading},
  year = {2026},
  url = {https://marketmaker.cc/en/blog/post/beyond-time-bars-candle-construction},
  description = {Two-axis classification of candle construction: 17 base bar types × 3 aggregation methods = 51 combinations, with implementation code and practical recommendations for crypto algotrading.}
}
Authors

Trading-systems engineer
Trading-systems engineer building bots since 2017: cross-exchange arbitrage (connected up to 30 venues), cointegration-based pairs arbitrage across spot and futures, scalping, news and sentiment-driven strategies, trend algorithms, and portfolio management and balancing algorithms. Also builds sub-millisecond order execution, big-data warehouses, backtesting engines, AI agents, and trading interfaces (incl. open-source profitmaker.cc). Stack: JS/TS, Python, Rust/Zig/Go, DevOps, backend, frontend, architecture.
Read More

researcher: A Searchable Quant-Research Archive for Humans and AI Agents

VectorBT: The Fastest Backtesting Framework for Python