Макалаларга кайтуу
May 16, 2025
5 мүн окуу
Trading Candles Demystified: How Raw Trades Become the Foundation of Market Analysis
candles
trading
aggregation
visualization
research
blog.disclaimer
MarketMaker.cc Team
Сандык изилдөөлөр жана стратегия
MarketMaker.cc Team
Сандык изилдөөлөр жана стратегия
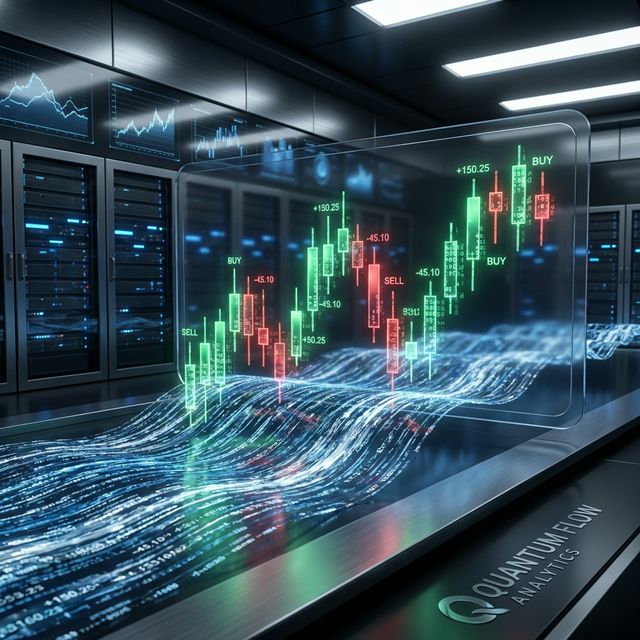 Data to Visuals: The algorithmic aggregation of raw high-speed trade streams into structured market candlesticks.
Candlestick charts are everywhere in trading — from professional terminals to meme crypto bots. But what exactly is a "candle," and how do we build them from the raw, chaotic stream of trades? In this article, we'll break down the process, highlight the tricky edge-cases, and share an interactive visualizer so you can see candles form in real time.
Try the visualizer here: candle-trade-visualizer.vercel.app
A candle (or candlestick) is a summary of market activity over a specific period (e.g., 1 minute, 1 hour, 1 day). Each candle contains:
It looks simple, but the devil is in the details.
Every millisecond, exchanges generate trades:
{
  "timestamp": 1714000000000,
  "price": 50000.0,
  "amount": 0.1,
  "side": "Buy"
}
There can be thousands of trades per second, each just a record of a buy or sell.
To build candles, we group trades by time. For example, all trades from 12:00:00 to 12:00:59 go into the same 1-minute (m1) candle.
Algorithm:
A robust aggregation must handle all these cases. In the industry, this is critical for accurate analytics and algorithmic trading.
Here's a minimal Rust example (the logic is the same in any language):
for trade in trades {
    let ts = truncate_to_tf(trade.timestamp, timeframe);
    if let Some(candle) = current_candle {
        if candle.timestamp == ts {
            // update high/low/close/volume
        } else {
            // save the current candle, start a new one
        }
    } else {
        // first candle
    }
}
Note: For correct aggregation, the trade stream should be sorted by time. If not, you need to sort first or use an algorithm that's robust to out-of-order data.
We built an interactive visualizer:
👉 candle-trade-visualizer.vercel.app
Candles are the foundation of all market analysis. Behind every simple chart is a complex aggregation process, designed to be robust against errors and edge-cases. If you're building your own systems, make sure to handle all the nuances — otherwise, your charts and strategies might be misleading.
Try the visualizer, dig into the details, and make your candles honest!
Links:
If you found this article useful, share it with your colleagues and let's make market data more transparent for everyone!
@software{soloviov2025tradingcandlesdemystified,
  author = {Soloviov, Eugen},
  title = {Trading Candles Demystified: How Raw Trades Become the Foundation of Market Analysis},
  year = {2025},
  url = {https://marketmaker.cc/en/blog/post/trading-candles-demystified},
  version = {0.1.0},
  description = {How are trading candles built from raw trades? This article explains the aggregation process, edge-cases, and offers an interactive visualizer to see candles form in real time.}
}