Suscríbete a nuestro boletín para recibir información exclusiva sobre trading con IA, análisis de mercado y actualizaciones de la plataforma.
Data to Visuals: The algorithmic aggregation of raw high-speed trade streams into structured market candlesticks.
Candlestick charts are everywhere in trading — from professional terminals to meme crypto bots. But what exactly is a "candle," and how do we build them from the raw, chaotic stream of trades? In this article, we'll break down the process, highlight the tricky edge-cases, and share an interactive visualizer so you can see candles form in real time.
There can be thousands of trades per second, each just a record of a buy or sell.
2. Time-Based Grouping
To build candles, we group trades by time. For example, all trades from 12:00:00 to 12:00:59 go into the same 1-minute (m1) candle.
Algorithm:
For each trade, determine which interval it belongs to (truncate timestamp).
If a candle for that interval exists, update its high/low/close/volume.
If not, start a new candle.
3. Edge-Cases: Why It's Not So Simple
Out-of-order trades: Trades may arrive out of sequence (due to network delays, etc.).
Duplicates: The same trade might appear more than once.
Boundary trades: What if a trade lands exactly on the interval boundary?
Gaps: What if there are intervals with no trades?
A robust aggregation must handle all these cases. In the industry, this is critical for accurate analytics and algorithmic trading.
Example: Candle Aggregation in Code
Here's a minimal Rust example (the logic is the same in any language):
fortradein trades {
letts = truncate_to_tf(trade.timestamp, timeframe);
ifletSome(candle) = current_candle {
if candle.timestamp == ts {
// update high/low/close/volume
} else {
// save the current candle, start a new one
}
} else {
// first candle
}
}
Note: For correct aggregation, the trade stream should be sorted by time. If not, you need to sort first or use an algorithm that's robust to out-of-order data.
Why Does This Matter?
Charts: All your favorite platforms (TradingView, Binance, etc.) build their charts from candles.
Algorithmic trading: Strategies operate on candles, not raw trades.
Analytics: Indicators, signals, and statistics are all based on OHLCV data.
AGI and automation: For machine analysis, you need strict, unambiguous data.
Experiment with different timeframes and edge-cases.
Conclusion
Candles are the foundation of all market analysis. Behind every simple chart is a complex aggregation process, designed to be robust against errors and edge-cases. If you're building your own systems, make sure to handle all the nuances — otherwise, your charts and strategies might be misleading.
Try the visualizer, dig into the details, and make your candles honest!
If you found this article useful, share it with your colleagues and let's make market data more transparent for everyone!
Citation
@software{soloviov2025tradingcandlesdemystified,
  author = {Soloviov, Eugen},
  title = {Trading Candles Demystified: How Raw Trades Become the Foundation of Market Analysis},
  year = {2025},
  url = {https://marketmaker.cc/en/blog/post/trading-candles-demystified},
  version = {0.1.0},
  description = {How are trading candles built from raw trades? This article explains the aggregation process, edge-cases, and offers an interactive visualizer to see candles form in real time.}
}


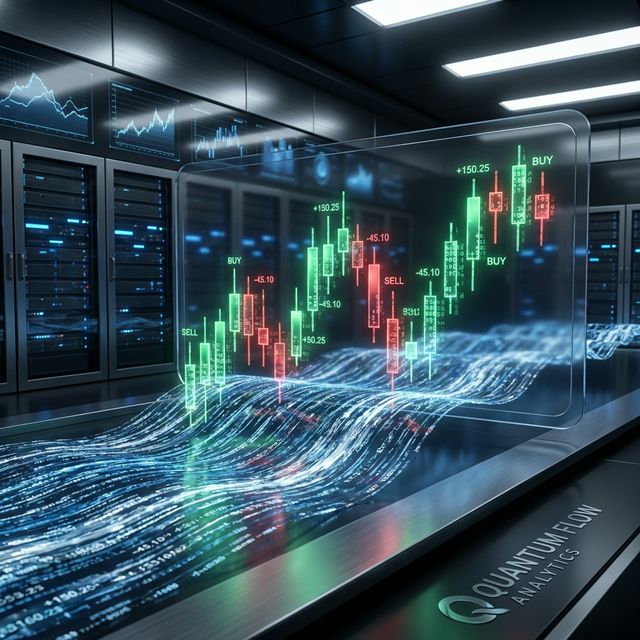 Data to Visuals: The algorithmic aggregation of raw high-speed trade streams into structured market candlesticks.