Backtesting Without Fooling Yourself
A step-by-step path from what your backtest really optimizes to proving an edge survives overfitting, multiple testing, and live execution. Read top to bottom - each part builds on the last.
Objective-Function Design: The Metric You Optimize Secretly Picks Your Strategy
To search for the 'best' strategy you must first define 'best' - and that scalar silently chooses the winner. On synthetic data with a known edge (600 seeds, T=2000, 80 thresholds), a naive per-trade Sharpe crowns a lottery: it picks a sub-5%-exposure winner in 56% of seeds and degenerates in 57% - on the starkest seed, 8 trades posting an in-sample Sharpe of 21.09 that collapses to 0.13 out of sample. The honest repair is almost dull: measure on the full timeline, which never degenerates (out-of-sample 1.71). A trade-count (conf_k) shrinkage and an exposure floor can retrofit a per-trade metric, but even fully repaired they only match full-timeline Sharpe (1.70 vs 1.71) - never beat it. Goodhart's law, in a backtest, with controlled ground truth.

Proving No Look-Ahead in Multi-Timeframe Backtests: Perturb the Future, Prove the Past Can't See It
Multi-timeframe backtests leak the future through a forming higher-timeframe bar whose final close does not exist yet. You cannot code-review your way to confidence - you have to test it. We reproduce the live bot's closed-bar rule exactly, then prove no leakage with a shifted-future probe: perturb every future bar and assert every past signal and trade is bitwise unchanged. 25/25 parity checks, and the probe has teeth.

Look-Ahead Bias: How a One-Bar Mistake Manufactures a Sharpe of 15 From Pure Noise
A controlled study of the subtle look-ahead leaks that quietly inflate backtests. With zero real edge, a same-bar fill manufactures an annualized Sharpe of +14.8 out of pure noise; a one-bar indicator peek, +4.8. The taxonomy, the measured magnitudes, and how to detect each leak before it costs you money.

Walk-Forward Optimization: The Only Honest Strategy Test
Why a single train/test split does not protect against overfitting, how walk-forward optimization systematically verifies parameter robustness, and why a strategy with +3342% PnL@ML on 21 parameters is a ticking time bomb without WFO.

Plateau Analysis: How to Distinguish a Robust Optimum from Overfitting
Why finding the best strategy parameters is only half the work. How to visually and quantitatively distinguish a stable plateau from a fragile peak, and why Optuna contour plots are a mandatory step before launching an optimized strategy into production.

Multi-Symbol Validation: Test Your Strategy on All Pairs
Why a strategy optimized on ETHUSDT may fail on altcoins. How to properly test across pair groups (blue chips, large caps, shitcoins) and what cross-symbol robustness score to consider sufficient.

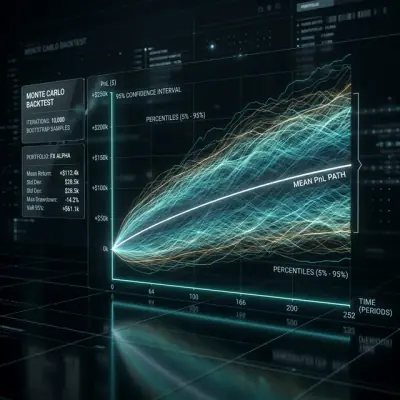
Monte Carlo Bootstrap: How to Get Confidence Intervals for a Backtest in 10 Lines of Code
Why a single-point estimate from a backtest is a dangerous illusion. How Monte Carlo bootstrap in 2 seconds of computation gives you a 95% confidence interval for PnL and MaxDD, and why this is a mandatory step before launching a strategy in production.
The Probability of Backtest Overfitting: Did Your Search Beat a Coin Flip?
The Deflated Sharpe Ratio prices the winning strategy; PBO prices the search that picked it. Combinatorially Symmetric Cross-Validation runs C(16,8) = 12,870 train/test splits over a 1000x200 performance matrix and asks: does the in-sample winner land in the bottom half out of sample? The catch almost everyone misses - PBO's null is 0.5, not 1. On 200 zero-edge strategies the best in-sample annualized Sharpe of 1.98 collapses to 0.06 out of sample and PBO = 0.476: a coin flip, fully overfit. Plant a real edge (annualized Sharpe 2.38) and PBO drops to 0.001, the in-sample 3.73 surviving to an out-of-sample 2.34. A moving-average grid on a pure random walk has no out-of-sample skill either - PBO 0.463 averaged over 60 matrices, statistically indistinguishable from the null - and on one representative matrix the mirage is vivid: a best in-sample Sharpe of 2.33 collapses to a median out-of-sample -0.22, PBO 0.573, a 63% chance of a loss.

The Deflated Sharpe Ratio: How Many of Your Backtest 'Winners' Survive Multiple Testing?
A parameter search is a machine for manufacturing luck. On pure noise - 1,000 strategies with zero true edge - the best annual Sharpe averages 1.63 and the naive significance test flags a discovery 100% of the time. We build controlled ground truth and show that the Deflated Sharpe Ratio, the Harvey-Liu haircut, and White's Reality Check restore honesty: false discoveries drop from 1.000 to 0.001-0.057, genuine edges above the noise ceiling are kept with power ~1 - and one real trap (correlated grids) where the raw DSR over-deflates and the verdict must be read across a whole band of effective-trial estimates, not one.

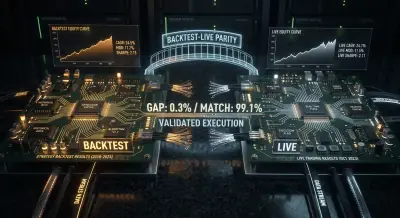
Backtest-live parity: why your bot trades differently from the backtest
Complete taxonomy of divergences between backtesting and live trading: from slippage and partial fills to codebase desynchronization. Architectural patterns for achieving parity, Python examples of a shared core module, and a production monitoring checklist.
The Honest Negative: Tens of Thousands of Backtests, Five Majors, No Robust Edge
The capstone of the search-and-overfit arc, and it ends in a negative result - the correct one. A single-symbol dual-timeframe search on ETHUSDT found a config worth +16.35% out-of-sample and +2.62% on an untouched holdout; the Deflated Sharpe Ratio, accounting for ~37,000 trials, deflated it to 0.00. A cross-instrument pass over five majors (ETH/BTC/SOL/BNB/XRP, ~1.18M 1m bars each), selecting by median out-of-sample, kills it for good: dual DSR 0.24 / PBO 0.264, triple DSR 0.14 / PBO 0.327 - both fail the gates. The champion is profitable on 1 of 5 symbols and negative on the rest. This is what the anti-overfit apparatus is for: to stop you from shipping the best of noise as alpha.
Cascade Strategies: Priority Execution with Fallback Filling
Finale of the 'Backtests Without Illusions' series. How to build an orchestrator from N strategies x M pairs, implement cascade mode with priority and fallback filling, choose dual_size, and why strategy portfolios cannot be backtested by summing PnL.