OneTick: The Platform Where Exchanges Catch Spoofers and Hedge Funds Hunt Alpha
Architecture of OneTick - an enterprise-grade time-series engine for tick data. DAG queries via Event Processors, unified real-time and historical data, market surveillance (MiFID II, MAR, SEC), TCA, quant research, and comparison with kdb+.

Bloomberg is for analysts who need a terminal. TradingView is for retail traders who need charts. But when an exchange wants to detect in real time that a trader on one venue is placing fake orders to move the price on another — it needs OneTick.
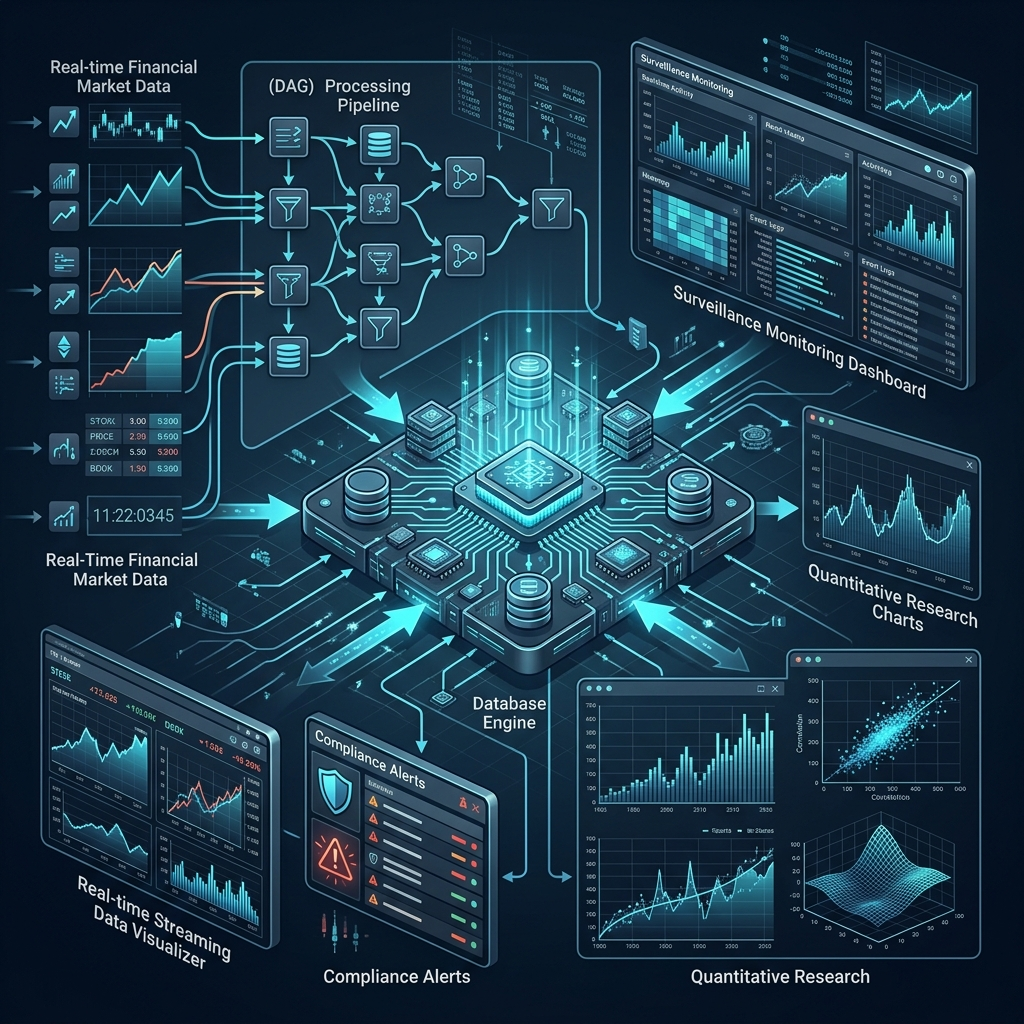
OneTick is an enterprise-grade time-series database and streaming analytics engine designed specifically for financial markets. Not a general-purpose TSDB like TimescaleDB or InfluxDB. Not just a fast columnar store like ClickHouse. It's a platform that understands financial data: trade/quote relationships, order book depth, corporate actions, and cross-market correlations. Its clients include exchanges, investment banks, hedge funds, market makers, and brokers.
Three Pillars of OneTick
The platform solves three fundamentally different problems with a single engine:
| Pillar | Who Uses It | Why |
|---|---|---|
| Market Surveillance | Exchanges, regulators, compliance departments | Manipulation detection, MiFID II / MAR / SEC / FINRA compliance |
| Quant Research | Hedge funds, prop desks | Alpha generation, strategy backtesting, microstructure analysis |
| Trading Analytics | Sell-side desks, brokers | TCA, best execution monitoring, liquidity control |
The key insight: all three workloads run on one engine that processes both historical and real-time data. No need for a separate streaming system and a separate backtesting system — it's a single platform.
Architecture: Directed Acyclic Graph (DAG) as a Query Language

OneTick's core architectural decision: queries are built not in SQL (though SQL is also supported) but as a Directed Acyclic Graph (DAG) of Event Processors (EPs).
What Is an Event Processor
An Event Processor is an atomic unit of computation. Each EP performs a single operation: filtering, aggregation, joins, derived field calculations, VWAP computation, or order book reconstruction. Data (ticks) flows through a chain of EPs from sources to sinks.
Analogy: an assembly line in a factory. A tick (a timestamped record) enters the graph on the left, passes through a chain of processors, and the output is a finished result: an alert, an aggregated metric, or a signal.
Why DAG Instead of SQL
| Aspect | SQL Approach | DAG (Event Processors) |
|---|---|---|
| Stream Processing | Requires a separate framework (Flink, Spark) | Native — the same graph works on both streams and history |
| Complex Pipelines | Nested subqueries, CTEs, window functions | Visual node composition — each node is understandable in isolation |
| Reusability | Copy-paste SQL blocks | EPs are reusable components plugged into different graphs |
| Debugging | EXPLAIN ANALYZE + guesswork | Data can be tapped at any node in the graph |
| Parallelism | DBMS optimizer decides | Explicit parallelization by symbols, dates, CPU cores |
Graphs can be built visually via the built-in designer ("paint-a-canvas") or programmatically through the Python API.
Performance
Numbers that OneTick claims (and that are confirmed by the industry):
| Metric | Value |
|---|---|
| Tick ingestion | >1 trillion ticks/day |
| Bulk processing | >10 million ticks/sec/core |
| Timestamp precision | Sub-millisecond |
| Historical depth | Data from 1970 (via TickData) |
| Asset classes | Equities, futures, options, fixed income, crypto |
For reference: a typical L2 feed for a single liquid stock (AAPL) generates ~100K messages/sec during peak hours. For the entire US equities market — hundreds of millions of messages per day. OneTick is designed to handle all of this with headroom to spare.
Market Surveillance: Where OneTick Is the Industry Standard

Market Surveillance is arguably OneTick's strongest use case. The platform is used by exchanges themselves to monitor trading activity.
What Manipulations It Detects
| Manipulation | What Happens | How It's Detected |
|---|---|---|
| Spoofing | Trader places a large order to move the price, then cancels before execution | Analysis of placed/cancelled order ratios, cancellation speed |
| Layering | Multiple orders at several price levels to create the illusion of supply/demand | "Staircase" pattern in the order book + correlation with executions on the opposite side |
| Wash Trading | Trader trades with themselves to create artificial volume | Account cross-referencing, timing analysis, IP addresses |
| Front-Running | Broker trades ahead of a large client order | Temporal correlations between prop trades and client flows |
| Marking the Close | Deliberate trades at session end to manipulate the closing price | Activity analysis in the last minutes vs. intraday average |
| Quote Stuffing | Mass generation/cancellation of orders to slow down competitors | Anomalous message frequency, order-to-trade ratio |
| Insider Trading | Trading based on non-public information | Correlation of unusual patterns with corporate events |
Cross-Market and Cross-Asset Monitoring
The most complex case: manipulation across markets. A trader moves the futures price on one exchange while profiting from a related option on another. Or trades an ADR on NYSE knowing what will happen to the underlying stock on LSE.
OneTick aggregates data from multiple venues into a single stream and searches for cross-market patterns, even when structural links between instruments are not obvious.
Regulatory Coverage
| Regulator / Standard | Jurisdiction |
|---|---|
| MiFID II / MAR | Europe |
| SEC / FINRA | USA |
| ASIC | Australia |
| IIROC | Canada |
White-Box AI for Alert Scoring
The classic surveillance problem is false positives. With 10,000 alerts per day, a compliance team of 5 has no chance of reviewing each one. OneTick uses "white-box" ML: models assess the probability of actual manipulation while showing the reason — exactly which factors led to a high score. Not a black box, but an explainable model, which is critical for regulators.
Quant Research: From Ticks to Alpha
For hedge funds and quant desks, OneTick is not just a data store. It's a research environment where data and analytics live in one place.
What You Can Do
-
Market microstructure analysis. Reconstruct the order book at any point in the past, analyze depth of liquidity, spreads, and order flow imbalance.
-
Strategy backtesting. Run trading strategies on historical tick data with point-in-time accuracy. No look-ahead bias — data is returned strictly in the order it was available in real time.
-
Signal generation. Test hypotheses: "If the bid-ask spread widens by 3σ with rising volume — is that a reversal predictor?" Across decades of data, across all instruments.
-
ML on tick data. MDRE (Market Data Research Environment) — a Python/Pandas-like API for data science. Hyperparameter tuning, cross-validation, model serving — directly on tick data, without exporting to a separate system.
Access Methods
| Interface | For Whom |
|---|---|
| Python / Pandas API | Data scientists, ML engineers |
| SQL | Analysts familiar with relational databases |
| DAG Designer | Visual query building |
| Proprietary Graph Language | Experienced OneTick users |
Trading Analytics: TCA and Best Execution
After MiFID II, best execution is not a recommendation — it's a legal requirement. Brokers must prove they executed client trades at the best available price.
Transaction Cost Analysis (TCA)
OneTick allows you to compare execution prices against benchmarks:
| Benchmark | What It Measures |
|---|---|
| VWAP | Volume-weighted average price over a period |
| Arrival Price | Price at the moment the order was received |
| Implementation Shortfall | Difference between the decision to trade and actual execution |
| Spread Cost | Losses on the bid-ask spread |
Real-Time Liquidity Monitoring
For FX desks and algo traders: OneTick compares current spreads and volumes against historical averages. If the EUR/USD spread widens by 2σ from the monthly average — that's an anomaly, and the algorithm can slow down execution or switch to an alternative venue.
Deployment: On-Prem and Cloud
| Model | Description |
|---|---|
| On-Premises | Full control, data never leaves the perimeter. For banks with strict data residency requirements |
| OneTick Cloud | Fully managed service. Scaling without infrastructure management |
| Hybrid | Historical data in the cloud, real-time on-prem next to the trading engine |
Comparison with Alternatives
| Feature | OneTick | kdb+ (KX) | QuestDB | TimescaleDB |
|---|---|---|---|---|
| Specialization | Finance — out of the box | Finance — via development | General TSDB | General TSDB |
| Query language | DAG + SQL + Python | q (vector, high learning curve) | SQL | SQL |
| Streaming + History | ✅ Unified engine | ✅ (kdb Insights) | ⚠️ Limited | ⚠️ Via extensions |
| Surveillance | ✅ Ready-made models | ❌ Must build | ❌ | ❌ |
| TCA | ✅ | ❌ Must build | ❌ | ❌ |
| Ingestion | >10M ticks/sec/core | ~10M+ ticks/sec/core | ~3M+ rows/sec | ~1M+ rows/sec |
| Developer cost | Lower (ready EPs) | High (q specialists) | Low (SQL) | Low (PostgreSQL) |
| Open Source | ❌ Enterprise | ❌ Enterprise | ✅ Apache 2.0 | ✅ Apache 2.0 |
| Cloud | ✅ OneTick Cloud | ✅ kdb Insights | ✅ QuestDB Cloud | ✅ Timescale Cloud |
When to Choose OneTick
- You're an exchange or regulator and need surveillance with ready-made detection models.
- You're a sell-side desk and regulators require TCA and best execution reporting.
- You're a quant fund and need a platform where historical research and live monitoring are the same tool.
When OneTick Is Overkill
- You're a retail trader or a small crypto team. OneTick is an enterprise product with enterprise pricing.
- You need just a database without analytics. QuestDB or TimescaleDB would be more reasonable.
- Your data is not financial ticks. IoT, monitoring, logs — that's a different niche, and OneTick is overkill.
Ecosystem: OneTick + TickData
OneTick is tightly integrated with TickData — one of the largest providers of historical tick data. Coverage:
- US Equities — from 1970
- Global exchanges — 80+ venues
- All asset classes — equities, futures, options, fixed income, FX
- Crypto — spot and derivatives
For quant research this is critical: the deeper the history, the more reliable the backtest. Data from 1970 allows testing strategies across dozens of market regimes, including the crashes of 1987, 2000, 2008, and COVID-2020.
Links
- 🌐 OneTick: onetick.com
- 🌐 OneTick Use Cases: onetick.com/use-cases
- 📊 TickData: tickdata.com
- 🌐 kdb+ (KX): kx.com
- 🌐 QuestDB: questdb.io
- 🌐 TimescaleDB: timescale.com
Conclusion
OneTick is not "just another time-series database." It's a vertically integrated platform for financial data that addresses three critical needs with a single engine: surveillance for exchanges and compliance, quant research for hedge funds, and TCA/best execution for sell-side. The DAG architecture built on Event Processors is an elegant solution for a world where the same data needs to be analyzed both in real time and across deep history.
The main pitfall when choosing: don't compare OneTick with QuestDB or TimescaleDB as "database vs. database." OneTick is a database + analytics engine + ready-made business applications (surveillance models, TCA benchmarks, compliance reports). If you need just fast tick ingestion — take QuestDB. If you need the full loop from data ingestion to regulatory reporting — OneTick competes only with kdb+, and wins through a lower barrier to entry (no need to learn q) and ready-made business modules.
For algotrading teams building their own infrastructure, OneTick is a reference point: how a platform should be designed that processes a trillion ticks per day while still allowing an analyst to build a query visually, without writing a single line of code.