Anomaly Detection for Trading Bot Protection: From Z-Score to Transformer

Anyone who has ever run a trading bot on crypto exchanges knows the feeling: the bot runs perfectly for a week, then wipes out a week's worth of profit in 30 seconds. A flash crash on one exchange. A fake wall in the order book. A liquidation cascade. Or the exchange simply returned garbage instead of data.
All these situations have one thing in common — they are anomalies. And if your bot can't recognize them, sooner or later it will become their victim.
What Counts as an Anomaly in Crypto Trading
Before chasing anomalies, we need to agree on what we're looking for. Machine learning distinguishes three types, and all three occur on crypto markets daily.
Point anomalies — isolated events that deviate sharply from the norm. A candle with volume 50 times above the average. The BTC/USDT spread on Binance spiking to 0.5%. For a market-making bot, each such event is a potential trap: entering a position at a fake price or suffering slippage that eats up the entire margin.
Collective anomalies — a series of events that look normal individually but signal a problem in aggregate. The classic example is spoofing: someone places and cancels large limit orders over several minutes. Each individual order is ordinary, but the "place-cancel-place-cancel" pattern with an order-to-trade ratio of 100:1 is manipulation — and a bot that relies on order book depth will be trading on nonexistent liquidity.
Contextual anomalies — a normal value in the wrong context. Bitcoin trading volume typical for the London session, but observed at 3 AM UTC on a Sunday. Without considering context, such anomalies are invisible — and these are the ones that most often slip past basic detectors.
 Visualization of three main types of anomalies in trading data: point spikes, collective patterns, and contextual deviations.
Noise vs. Anomaly: The Context Problem
An anomaly is not just "strange data." It is a deviation that carries information. It is crucial to distinguish:
- Noise: Random fluctuations that are part of the normal market regime.
- Drift: A gradual shift in market conditions (e.g., transition from low-volatility night to active morning).
- Anomaly: A sudden violation of the expected pattern.
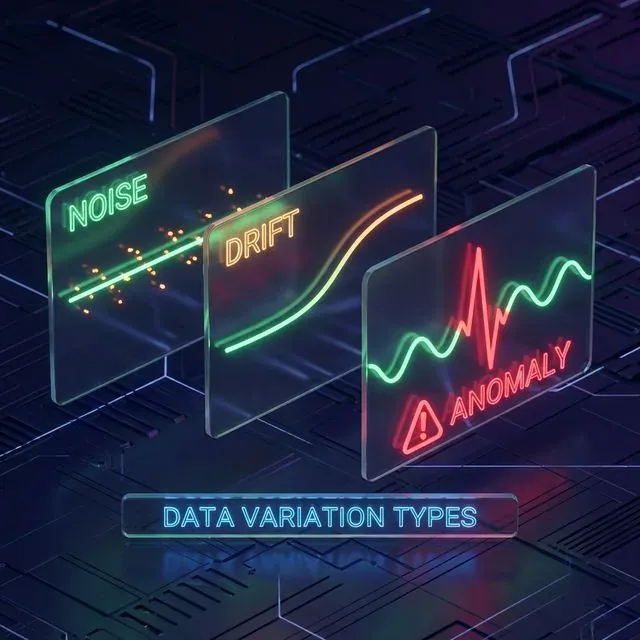 Determining the difference between harmless noise, persistent drift, and dangerous anomalies is a key challenge for any detector.
Simple Methods That Solve 80% of Problems
Not everything needs to be solved with neural networks. Three basic detectors are enough for most trading bots.
Z-Score: Fast Extreme Filter
Z-Score shows how many standard deviations the current value deviates from the rolling mean. Calculated in microseconds, works on any timeframe.
We use it for three tasks: abnormal volume filtering (Z-Score > 3 — signal to widen spreads or pause quoting), spread monitoring (abnormal bid-ask widening often precedes sharp movements), and futures funding rate (extreme values warn of a probable liquidation cascade).
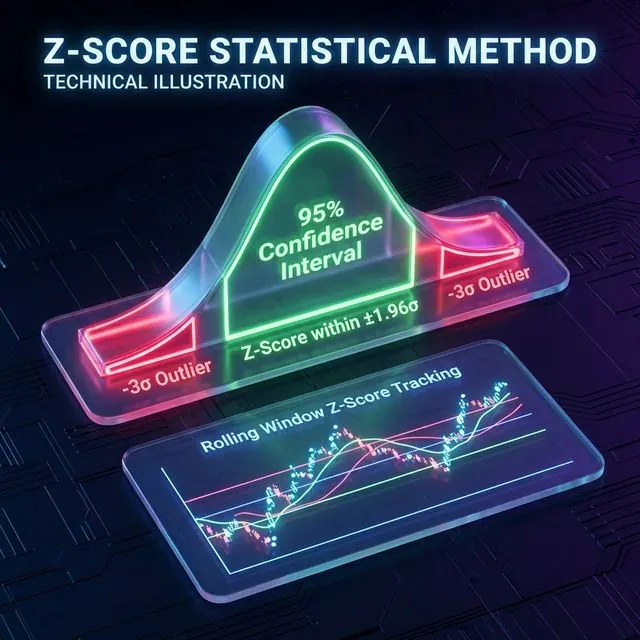 Z-Score identifies extreme events by measuring how many standard deviations a point is from the mean. Values exceeding ±3σ are treated as outliers in most trading systems.
Important limitation: crypto markets have fat-tailed distributions. An event that by normal distribution should happen once in a million years (6σ) happens monthly in crypto. So Z-Score is a coarse anomaly filter, not a final verdict.
Level Shift Detector: When the Market Changes Regime
We take two consecutive rolling windows and compare their averages. If the difference exceeds a threshold — a level shift has occurred. Market-making strategies profit in a stable market and lose during sharp movements. A Level Shift Detector on volume and volatility warns of a regime change minutes before it becomes obvious in the price.
We apply it to several metrics simultaneously: average trade size, order book depth at the first 5 levels, number of trades per unit time. If Level Shift triggers on at least two metrics — the bot switches to defensive mode.
Volatility Shift Detector: Sensing the Storm
A similar approach, but standard deviations are compared instead of averages. A sharp rise in volatility is a signal to reconsider parameters. An interesting pattern: abnormally low volatility often precedes an explosive move. The Volatility Shift Detector catches both cases — compression and expansion.
 Level Shift and Volatility Shift detectors are key for identifying 'Regime Changes' — sudden structural shifts in market behavior that require different trading parameters.
HBOS: Fast Multidimensional Analysis
When you need to monitor 10+ indicators simultaneously without the cost of complex ML, HBOS (Histogram-Based Outlier Selection) is the best choice. It assumes feature independence and builds a histogram for each. The anomaly score is the product of inverse densities across all histograms.
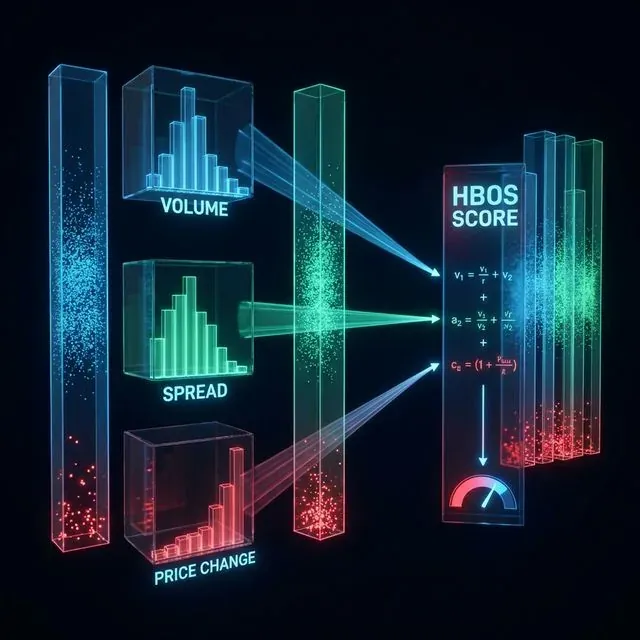 HBOS is significantly faster than distance-based methods like LOF, making it suitable for high-frequency filtering of multidimensional state vectors.
Machine Learning: When Statistics Aren't Enough
Basic methods work with one indicator at a time. But real anomalies often manifest as an unusual combination of indicators: volume is normal, spread is normal, but volume + spread + rate of price change + order book imbalance together — are anomalous. This is where ML is needed.
 A structured landscape of anomaly detection methods: from classical unsupervised algorithms to deep learning architectures.
Isolation Forest: Best Balance for Production
Of all ML anomaly detection methods, Isolation Forest best fits trading systems. The algorithm builds an ensemble of decision trees that randomly partition the feature space. Anomalous points, being "rare and different," are isolated in fewer splits.
Why Isolation Forest? It doesn't require labeled data — labeling anomalies on crypto markets is practically impossible since every flash crash is unique. Fast inference in milliseconds makes near-real-time use feasible. And critically for production: predictions can be explained through SHAP values — you don't just know that a moment is anomalous, you understand why.
On Bitcoin data, Isolation Forest detected not only obvious anomalies like the volatility spike when Tesla rejected BTC payments in 2021, but also subtle ones — periods when price movements weren't supported by volume, indicating external manipulation. When analyzing spoofing, SHAP shows that key indicators are unbalanced order book quotes and abnormally high cancellation activity.
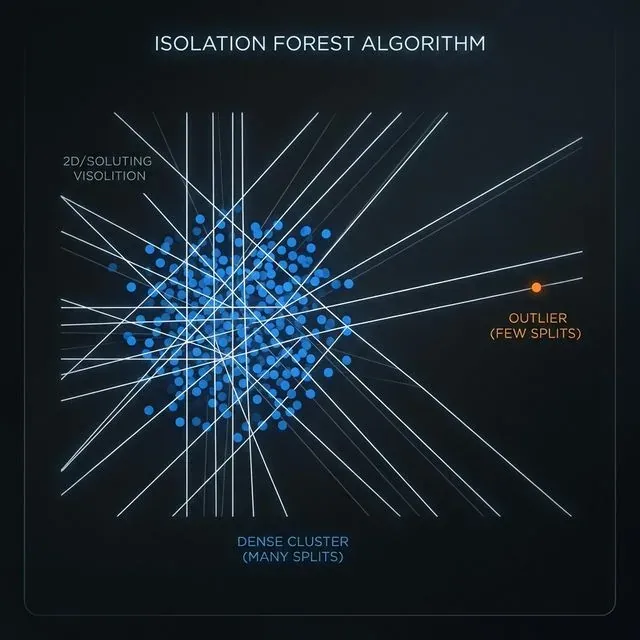 The Isolation Forest algorithm works by randomly partitioning the space: outliers are isolated in significantly fewer splits than points in dense clusters.
LOF: Best Choice for Multi-Exchange Monitoring
Local Outlier Factor assesses a point's anomalousness by comparing its local density to that of its neighbors. A study (Springer, 2024) comparing LOF, Isolation Forest, and One-Class SVM on cryptocurrency data found LOF to be the most effective — it found real anomalies with the fewest false positives, performing stably on both Bitcoin and Dogecoin.
Why does LOF matter for multi-exchange infrastructure? Data from different exchanges have different "density" — Binance sees thousands of trades per second, a niche exchange sees dozens. Global methods like Z-Score will produce false positives on niche exchanges or miss anomalies on large ones. LOF adapts to local context.
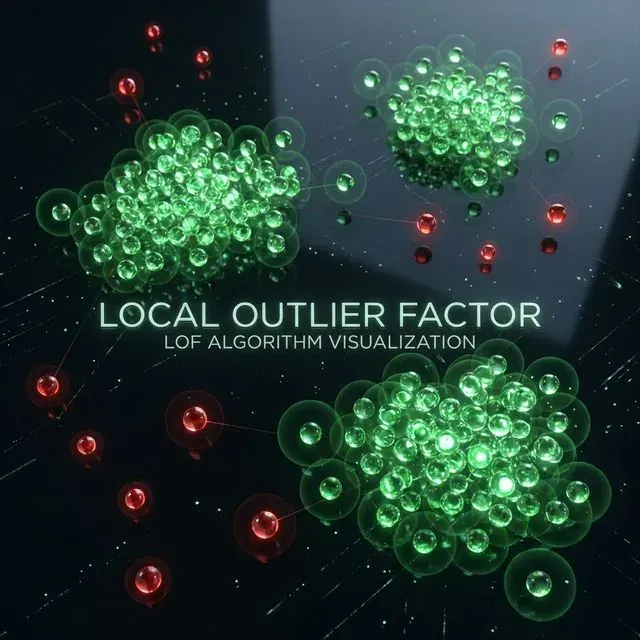 LOF compares a point's local density with its neighbors. This allows it to find outliers that are 'locally' anomalous even if they are consistent with global data patterns.
The limitation is quadratic complexity with respect to the number of points. For tick-level real-time data it's too slow, but for minute aggregates across 100+ exchanges — ideal.
Autoencoders: Deep Order Book Analysis
An autoencoder is a neural network that compresses data into a compact representation and reconstructs it. Trained on "normal" data, a high reconstruction error then signals an anomaly.
For order book analysis this is the most powerful tool. An order book with 20 bid and 20 ask levels is a 40-dimensional vector updating hundreds of times per second. An LSTM Autoencoder considers not just the current state but the dynamics — how the order book changed over the last N ticks. The hybrid "LSTM Autoencoder + One-Class SVM" approach separates concerns: the neural network handles feature extraction, classical ML handles decision-making. The main drawback is computational cost: real-time inference requires a GPU.
 Autoencoders learn a compressed 'latent' representation of normal data. Anomalies fail to reconstruct accurately, resulting in a high error score used for detection.
Cascading Architecture: Putting It All Together
No single method solves all problems. Fast methods miss complex anomalies. Accurate methods are too slow for real-time. The solution is a cascading architecture where each subsequent layer catches what the previous one missed.
 Multi-layered anomaly detection architecture: from millisecond hard limits to background deep learning analysis.
Layer 1 — Fast Path (under 1 ms). Z-Score on volume, spread, and price change. Persistence check. Hard limits. On trigger — immediate trading pause. This layer protects against flash crashes, API errors, and coarse manipulations. Implemented in the bot's main loop without external dependencies.
Layer 2 — Near Real-Time (1–100 ms). Isolation Forest on combined features. Level Shift and Volatility Shift detectors. On trigger — trading mode switch, parameter adjustment. Runs in a parallel thread.
Layer 3 — Background Analysis (1–60 seconds). LOF on multi-exchange data. LSTM Autoencoder on order book states. Seasonal decomposition residual analysis. On trigger — alerts, strategy parameter adjustments.
Layer 4 — Batch Analysis (hourly/daily). DBSCAN for wash trading detection. PCA for cross-exchange correlation monitoring. Full model retraining. Output — reports, model updates, threshold recalibration for previous layers.
Each layer operates independently. If layer 3 goes down — layers 1 and 2 keep protecting the bot. Fault tolerance and graceful degradation are mandatory properties of any trading infrastructure.
Practical Recommendations
A few lessons from production.
Start simple. Z-Score + Level Shift + Volatility Shift can be implemented in a day. This covers the majority of loss scenarios due to abnormal market conditions. The GPU cluster can come later.
Contamination parameter is the most important hyperparameter. In Isolation Forest it defines the expected proportion of anomalies. For crypto markets we use 0.01–0.05 depending on the pair and exchange. Too low — you miss real anomalies. Too high — false positives paralyze trading.
Adaptive thresholds instead of fixed ones. Crypto markets are non-stationary. A threshold that worked in January will generate false positives in March. Use EWMA to update thresholds, or periodically retrain models on a rolling window.
Log all anomalies. Even if you don't react automatically — save the label with context. In a month you'll have a dataset for training supervised models and analyzing which anomalies preceded losses.
Test on real incidents. Build a collection of historical anomalies: the May 2021 flash crash, the FTX liquidation cascade, the LUNA collapse. Run every new detector through these scenarios. If it doesn't catch known incidents — it's useless.
What's Next
Three directions worth watching.
Transformer-based models for order books. Recent research shows that Transformer autoencoder + OC-SVM on Limit Order Book data significantly outperforms all previous approaches for spoofing detection. A Staged Sliding Window Transformer on high-frequency EUR/USD data (315 million records) achieved accuracy 0.93, F1 0.91, AUC-ROC 0.95 — significantly better than Random Forest, LSTM, and CNN.
 Transformer architectures with multi-head attention are proving exceptionally capable at identifying complex temporal patterns in high-frequency Limit Order Book data.
GANs for synthetic anomaly generation. One of the main challenges is the lack of labeled data. GANs can generate realistic manipulation scenarios for training supervised models. Architectures already exist achieving 94.7% accuracy with latency under 3 ms and throughput of 150,000 transactions per second.
 Generative Adversarial Networks (GANs) can be used to augment datasets by creating realistic synthetic anomalies, solving the critical label scarcity problem in trading.
Change Point Detection (CPD). Instead of just looking for outliers, CPD focuses on identifying the exact moment when the statistical properties of the signal changed. This is critical for switching between market-making regimes (e.g., from mean-reversion to trend-following).
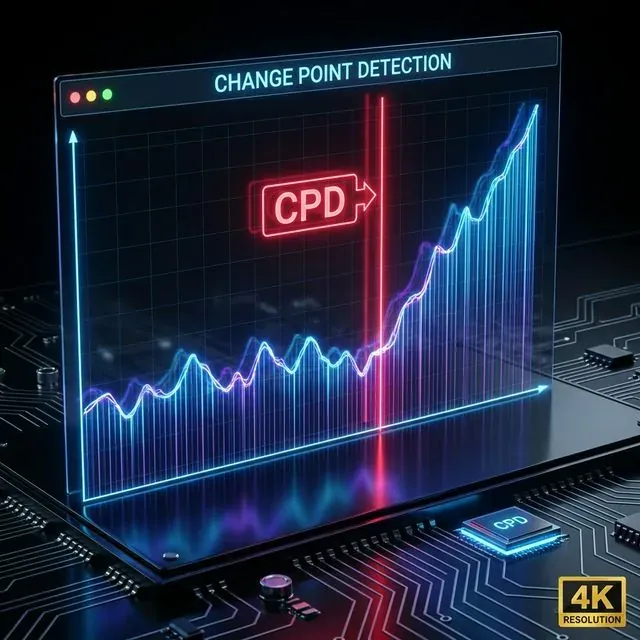 Change Point Detection identifies structural shifts in time-series data, highlighting the boundary between different market regimes.
Anomalies are not an optional feature. It's the foundation without which algo trading becomes gambling. And the sooner you build it, the fewer expensive lessons the market will need to teach you.
References
- Anomaly detection in cryptocurrency markets using Isolation Forest
- LOF: Identifying local outliers in high dimensional space
- Isolation Forest for Anomaly Detection (Sklearn Documentation)
- PyOD: A Comprehensive Python Toolbox for Outlier Detection
- Transformer-based models for Limit Order Book anomaly detection
- Ethical Issues and Market Manipulation in Cryptocurrency
Citation
@software{soloviov2026anomalydetectionalgotrading,
  author = {Soloviov, Eugen},
  title = {Anomaly Detection for Trading Bot Protection: From Z-Score to Transformer},
  year = {2026},
  url = {https://marketmaker.cc/en/blog/post/anomaly-detection-algotrading},
  version = {0.1.0},
  description = {Which anomaly detection methods actually work in crypto algo trading, how to build a cascading protection architecture, and why this is the foundation without which algo trading becomes gambling.}
}
MarketMaker.cc Team
Miqdoriy tadqiqotlar va strategiya
Read More

Funding Rates Kill Your Leverage: Why PnL×50x Is a Fiction

Loss-Profit Asymmetry: The Math That Kills Your Deposit