Assine nossa newsletter para insights exclusivos sobre trading com IA, análises de mercado e atualizações da plataforma.
Visualization of order book depth with the trader's position inside a price wall
How understanding your place in the queue at a price level transforms scalping from guesswork into an engineering problem
Introduction: Why the Aggregated Order Book Lies
Every trader who trades off the order book sees the same picture: bids on the left, asks on the right, and at each price level — a number showing the total volume of limit orders. For example:
2,400 lots at the 10000 level — that's a "wall" (density). And here lies a critically important question that most traders ignore: where exactly within those 2,400 lots is our order?
Price 10000 [ 1,800 lots BEFORE us ][ OUR ORDER 10 lots ][ 590 lots AFTER us ]
This is not academic curiosity. It's the difference between a filled and an unfilled order. Between profit and loss. Between a backtest that shows a beautiful equity curve and reality where your strategy doesn't work.
What Is Queue Position and Why Calculate It
Visualization of a FIFO queue: the trader's position among other orders at a price level
FIFO and Exchange Reality
The vast majority of exchanges — both traditional (CME, NASDAQ) and cryptocurrency (Binance, Bybit, OKX) — use the Price-Time Priority (FIFO) rule. This means: at the same price, the order that was placed first gets filled first.
When a market sell order arrives and "hits" our bid price level, it sequentially fills limit orders from the head of the queue to the tail. If the market order wasn't large enough to reach our position in the queue — we remain unfilled.
Two Components of Queue Position Value
Academic research (Moallemi & Yuan, Columbia Business School, 2017) identifies two components of queue position value:
Static component — the trade-off between spread capture and adverse selection. The further back we are in the queue, the higher the probability that we get filled by a large informed order (rather than noise). Put simply: if you're filled last in the queue — the price is most likely already moving against you.
Dynamic component — the optionality provided by queue position improvement over time. When orders ahead of us are cancelled or filled, our position improves without any action on our part.
Empirical data shows that for instruments with a large tick size, the value of queue position can be comparable to the spread size. This is an enormous magnitude.
How to Estimate Your Queue Position
The Estimation Problem
We place a limit order of size S at price P. At the time of placement, there are already Q lots at that price level. Our initial position estimate:
V̂(t₀) = Q(t₀) — number of lots ahead of us
Next, we track all volume changes at our price level. This is the key algorithm described by Erik Rigtorp and implemented in products by Trading Technologies (TT), Bookmap, and others.
Update Algorithm
For each decrease ΔQ at the price level, we need to determine: was the order ahead of us or behind us?
If we can distinguish fills (executions) from cancellations:
Fill (execution): unambiguously reduces the queue ahead of us → V̂ = max(V̂ + ΔQ, 0)
Cancel (cancellation): uncertainty — the cancelled order could have been either ahead of or behind us
For cancellations, a probabilistic model is used:
V̂(n+1) = max(V̂(n) + p(n) × ΔQ(n), 0)
where p(n) is the probability that the cancelled order was ahead of us. One family of models:
where f(x) is an increasing function, such as ln(1+x) or the identity function. The intuition: the larger the volume ahead of us relative to the volume behind us, the more likely the cancellation occurred ahead of us.
Data Levels and the Reality of Crypto Markets
Estimation quality directly depends on data granularity:
Data Level
What We See
PIQ Estimation Accuracy
Level 1 (BBO)
Best bid/ask + volume
Impossible to estimate
Level 2 (Price-aggregated)
Volume at each price level
Probabilistic estimation
Level 3 (Market-by-Order, MBO)
Each individual order with ID
Exact position
In crypto, the situation is as follows:
Binance — provides an L2 depth stream with updates every 100ms. L3 (MBO) data is not publicly available.
Coinbase — one of the few CEXs offering an L3 stream via WebSocket with full order-by-order data.
CME (BTC/ETH futures) — full MBO data via the ITCH feed.
Most crypto traders work with L2, meaning they rely on probabilistic estimates. But even a probabilistic estimate is radically better than none at all.
Visualization: The Wall as an Internal Order Book
We propose visualizing each significant density (wall) as a mini order book within the order book:
╔════════════════════════════════════════════════════════════════╗
║  Price 10001  │  150 lots                                     ║
╠════════════════════════════════════════════════════════════════╣
║  Price 10000  │  [████████████░░░▓▓░░░░░░░]  2,400 lots       ║
║               │   ↑ 1,800 before us  ↑ us  ↑ 590 after       ║
║               │   drain rate: ~120 lots/sec                   ║
║               │   ETA to fill: ~15 sec                        ║
╠════════════════════════════════════════════════════════════════╣
║  Price  9999  │  80 lots                                      ║
╚════════════════════════════════════════════════════════════════╝
What Is Calculated in Real Time
Lots ahead of our order — an estimate of the volume that must be filled or cancelled before it reaches us.
Lots behind our order — the volume placed after us. If the wall is rapidly "swelling" from the tail — other participants consider this level attractive.
Queue drain rate — calculated from actual trades (executions) at this price level. Expressed in lots/second.
Estimated Time to Fill (ETF) — a forecast of the time until our order is filled, calculated as lots_ahead / drain_rate.
Multiple orders in one density — the bot can track the position of each of its orders if there are several within the same wall.
Application in Scalping
Comparison of naive vs queue-aware backtesting: actual fill probability vs optimistic estimate
The Problem with Candlestick-Based Backtesting
A classic backtest on OHLCV candles works as follows: if the price reached our limit order — count it as filled. But this is a critical error:
Example. We have a buy-limit at 10000. In the 1-minute candle, low = 10000. The candlestick backtest counts it as a fill. But in reality:
There was a wall of 5,000 lots at the 10000 level
Our order was at the tail of the queue (position 4,800)
Only 2,000 lots traded through that level during this minute
In reality, our order would NOT have been filled
Queue-aware backtesting solves this problem: it models the queue position, counts trade volume at the level from tick data, and determines whether the traded volume was sufficient to reach our position.
More Than One Fill Per Minute
In active scalping, an order can be filled and re-placed multiple times within a single minute. A candlestick-based backtest simply cannot model this. Only tick-level analysis with queue modeling allows you to:
Determine the exact time of each fill
Understand whether we have time to re-place the order
Estimate how many times the strategy would actually have triggered within an interval
Predicting Time to Fill
A bot that knows its queue position and the current wall "drain" rate can:
Calculate ETA — approximate time to fill
Compare ETA with a price movement forecast — if ETA = 30 seconds, but our model predicts a reversal in 10 seconds, we should cancel the order
Adapt order size — a larger order is closer to the head of the queue on pro-rata exchanges (CME), but on FIFO exchanges, size doesn't affect queue position
Comparing Drain Rate to the Average
An invaluable metric for a scalper: current queue drain rate vs average rate over N candles.
Rate above average → high market order aggression → the wall may "break through" → our fill is more likely
Rate below average → the market has "stalled" → the wall will hold → the order will hang, and the price may move away
Where This Is Already Implemented: Market Overview
The most mature implementation. TT displays PIQ for each trader's order in the Floating Order Book column. For exchanges that provide queue position data directly through their feed (CME, ICE), exact values are shown. For others — a conservative estimate.
The professional version of Bookmap ($499/month) includes visualization of order queue positions and event export. Bookmap Quant uses MBO data, and its L0 API allows building custom adapters for any data source.
CQG provides queue position estimation for futures markets. The platform calculates a probabilistic PIQ estimate based on L2/L3 data and displays it in the DOMTrader interface.
Rithmic is a market data provider offering low-latency access to data for queue position estimation. It is used as an infrastructure layer by many prop trading firms and algorithmic traders to build their own PIQ models.
Jigsaw Trading specializes in order flow visualization with queue position estimation. Its Depth & Sales and Reconstructed Tape tools help traders see the real execution picture at price levels.
Academic Models
Moallemi & Yuan (2017) — a formal model for queue position valuation based on NASDAQ ITCH data
Cont, Stoikov & Talreja (2010) — a limit order book model as a birth-death process system
Gould & Bonart (2015) — queue imbalance as a predictor of mid-price movement
Deep Learning approaches — RNN models (Columbia, 2022) for estimating fill probabilities and fill times
What Does NOT Exist on the Market
None of the existing products offer visualization of a wall's internal structure for crypto markets in a format tailored for a scalping bot. This is the niche that Marketmaker.cc can fill.
Countering Manipulator Strategies
Detecting fake walls: genuine orders vs spoofing blocks with high cancel rates
Understanding the internal structure of a wall is not just about optimizing your own execution. It is a tool for protection against manipulation and, when used skillfully, a tool for reading the intentions of large players.
Spoofing: Fake Walls
Spoofing is the placement of large orders with the intention of cancelling them before execution. The goal is to create a false impression of supply/demand.
How PIQ analysis helps:
Speed of wall accumulation. A genuine wall builds up gradually. A spoofing wall appears instantly.
Behavior as price approaches. A genuine wall stays. A spoof wall "runs away."
Cancel rate. Spoofers cancel orders before execution. Tracking the placed/canceled ratio enables real-time spoof detection.
Cyclicality. Spoofing often exhibits repeating patterns: appear → disappear → appear at a new level.
Layering: Cascading Fake Levels
Layering is a more sophisticated form of spoofing where fake orders are placed across multiple price levels.
How PIQ analysis helps:
Correlated cancellations. If orders on 5 consecutive levels are cancelled simultaneously — it is almost certainly layering by a single participant.
Order book asymmetry. Genuine liquidity is usually distributed more or less evenly.
Reaction to fills. Genuine orders get filled and don't "run away."
Iceberg Orders: Hidden Liquidity
An iceberg is a large order split into small visible portions. After one portion is filled, the next one automatically appears.
How PIQ analysis helps:
The "immortal" level pattern. Volume is constantly being filled but doesn't decrease.
Absorption analysis. Price hits the wall, fills the visible volume, but the wall regenerates.
Queue behavior during absorption. Our position "slides" forward each time an iceberg slice is filled and re-placed at the tail of the queue.
The Market Maker as an "Invisible" Participant in the Wall
Professional market makers employ several tactics:
Quote stuffing — mass placement and cancellation of orders to "pollute" competitors' data
Penny jumping — placing an order one tick better than the competitor to capture priority
Dynamic quoting — adapting orders in real time as queue imbalance changes
Level defense — adding liquidity as price approaches
Implementation: Queue Position Tracker Module Architecture
Input Data
1. WebSocket order book stream (L2 depth):
   - Best bid/ask updates
   - Depth updates (volume at each price level)

2. WebSocket trade stream:
   - Each trade: price, volume, side (buy/sell), timestamp

3. Own orders (from the trading bot):
   - order_id, price, size, placement timestamp
Core Algorithm (Python-like Pseudocode)
classQueuePositionTracker:
def__init__(self, order_price, order_size, initial_depth):
self.price = order_price
self.size = order_size
self.queue_ahead = initial_depth # V̂(t₀) = Q(t₀)self.queue_behind = 0self.fill_velocity = EMA(span=30) # EMA of fill ratedefon_trade(self, trade_price, trade_size):
"""Called on each trade at our price level"""if trade_price == self.price:
self.queue_ahead = max(self.queue_ahead - trade_size, 0)
self.fill_velocity.update(trade_size)
defon_depth_change(self, new_depth, change_type):
"""Called when depth changes at our price level"""if change_type == 'cancel':
total = self.queue_ahead + self.size + self.queue_behind
p_ahead = log(1 + self.queue_ahead) / (
log(1 + self.queue_ahead) + log(1 + self.queue_behind)
)
cancelled = abs(new_depth - total)
self.queue_ahead = max(
self.queue_ahead - p_ahead * cancelled, 0
)
self.queue_behind = max(
self.queue_behind - (1 - p_ahead) * cancelled, 0
)
elif change_type == 'new_order':
added = new_depth - (self.queue_ahead + self.size + self.queue_behind)
self.queue_behind += added
@propertydefestimated_time_to_fill(self):
"""Estimated time to fill in seconds"""ifself.fill_velocity.value <= 0:
returnfloat('inf')
returnself.queue_ahead / self.fill_velocity.value
@propertydeffill_probability(self, horizon_sec=60):
"""Probability of fill within a given horizon"""
expected_volume = self.fill_velocity.value * horizon_sec
returnmin(expected_volume / max(self.queue_ahead, 1), 1.0)
Critical Edge Cases
Wall fully "eaten through" — if queue_ahead drops to 0, the next market order fills us
Mass cancellation (wall pull) — the wall abruptly disappears, queue_ahead changes sharply
Our order is moved — upon cancellation and re-placement, we go to the tail of the queue
Multiple orders in the same wall — each is tracked independently
Metrics for Dashboard and Backtesting
Real-Time (Scalping Terminal)
Metric
Formula
Color
Queue Position %
queue_ahead / total_depth × 100
Green < 30%, yellow 30-70%, red > 70%
ETA to Fill
queue_ahead / fill_velocity
Seconds
Wall Health
depth_now / depth_5sec_ago
Wall stability
Absorption Rate
filled_volume / visible_depth
Presence of hidden liquidity
Spoof Score
cancel_rate × sudden_appear × distance_from_price
0-100, fakeness indicator
For Backtesting (Queue-Aware Simulation)
Queue-adjusted fill rate — percentage of orders actually filled accounting for queue position
Effective fill latency — actual time from placement to execution
Adverse selection per fill — average price move against us after a fill
Queue velocity correlation — correlation between queue drain rate and subsequent price movement
Social Order Book: Team Orders Inside the Wall
Three-tier visibility model: personal orders, subscriptions, and team positions inside the wall
Tier 1: Exchange or Trading Platform
If you are an exchange or trading terminal, you possess absolute knowledge of every user's order position. The platform can show each user how much "other" volume stands before and after their order, without revealing other participants' identities.
Tier 2: Marketmaker.cc Platform — Personal Orders + Social Layer
At Marketmaker.cc, we plan to implement a three-tier order visibility model within the wall:
Personal orders — the base layer. Each trader sees all their own orders with individual metrics.
Subscription orders (signal providers) — traders who share positions via subscription. Opt-in mechanism: the leader decides whether to show positions.
Team orders (trading team / fund) — the most valuable layer for professional groups. Solves problems: order conflicts, liquidity allocation, team risk monitoring, training.
Permission Model
┌─────────────────────────────────────────────────────────────┐
│  Trader's order                                              │
│                                                              │
│  Visible to:                                                 │
│  ├── The trader themselves     → ALWAYS                      │
│  ├── Subscribers               → if trader enabled           │
│  │   ├── Display delay         → configurable (0s–60s)       │
│  │   ├── Show size             → yes / hide / round          │
│  │   └── Show ETA              → yes / no                    │
│  └── Team                      → if part of a team           │
│      ├── Delay                 → configurable (0s–5s)        │
│      ├── Show size             → yes (for risk management)   │
│      └── Role visibility       → trader / manager / viewer   │
└─────────────────────────────────────────────────────────────┘
Full Transparency: DEX Exchanges and On-Chain Order Books
On DEX exchanges with on-chain order books — primarily Hyperliquid — every order is tied to a specific wallet address. We can see not just the aggregated wall, but each individual order of every participant.
However, working with this data in real time requires running your own Hyperliquid blockchain node.
Automatic Identification of Manipulator Orders
The fourth visualization layer — algorithmic order classification by participant type: market makers, spoofers, retail. Classification algorithms operate on several levels: spoofing detection, market maker classification, squeeze scenario detection, and trader digital fingerprinting.
Analyzing order position within order book density is the next evolutionary step from "looking at the order book" to "understanding market microstructure." This is the territory where the following intersect:
Queueing theory — for modeling queues
Stochastic order flow models — for estimating fill probabilities
Machine learning — for spoofing detection and wall behavior prediction
Low-latency engineering — for receiving and processing data in real time
As of today, no product in the crypto market offers comprehensive visualization of the "wall as a mini order book" with user order positions, ETA estimation, spoofing detection, and queue-aware backtesting in a single interface.
At Marketmaker.cc, we are working to make this analytics accessible to every trader — from solo scalpers to prop trading teams.


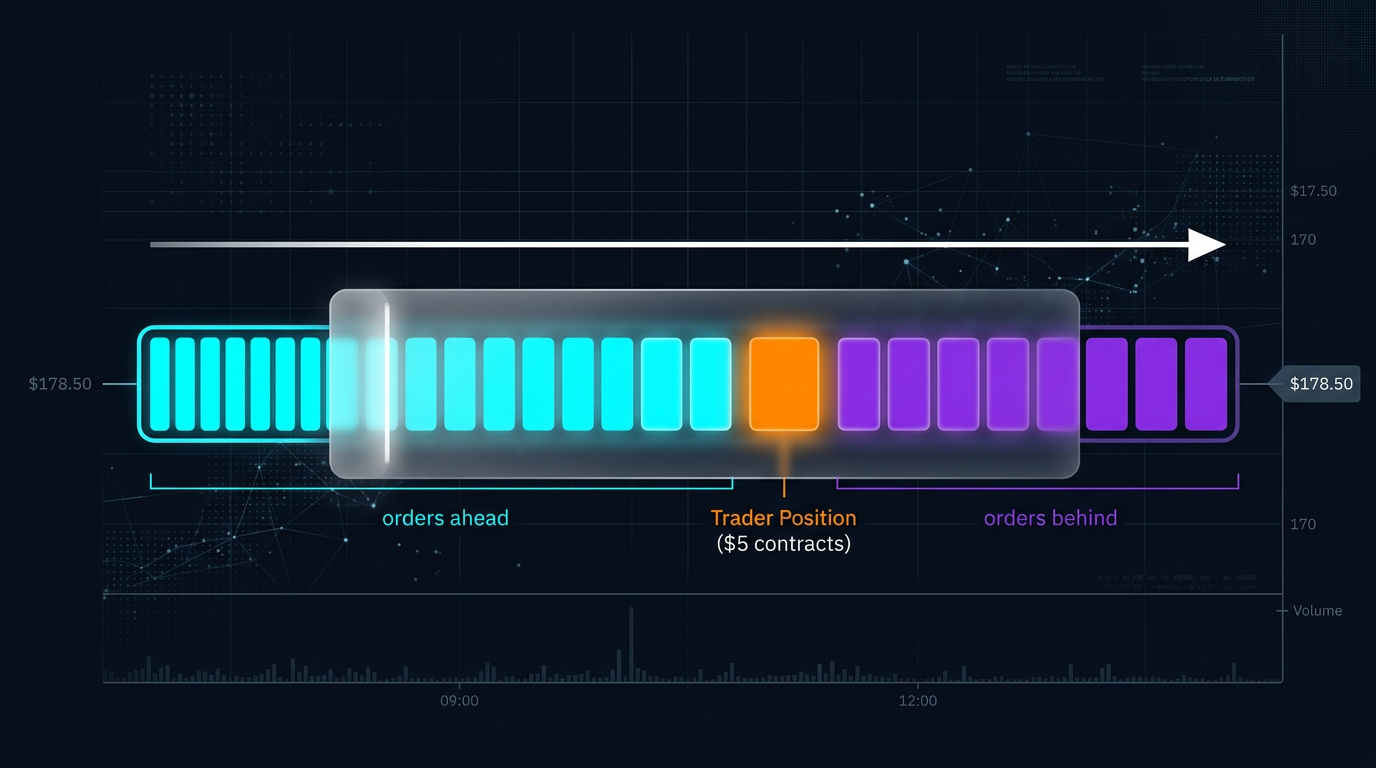 Visualization of a FIFO queue: the trader's position among other orders at a price level
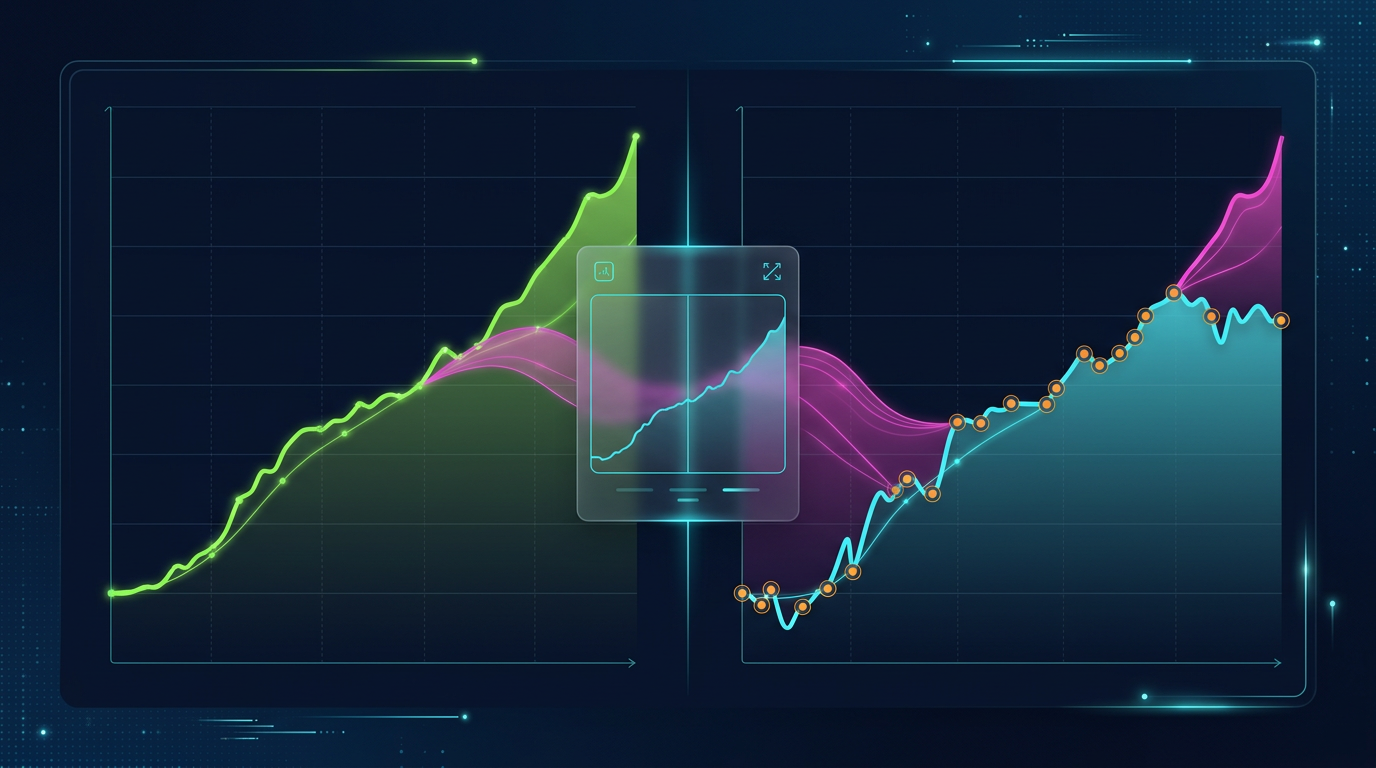 Comparison of naive vs queue-aware backtesting: actual fill probability vs optimistic estimate
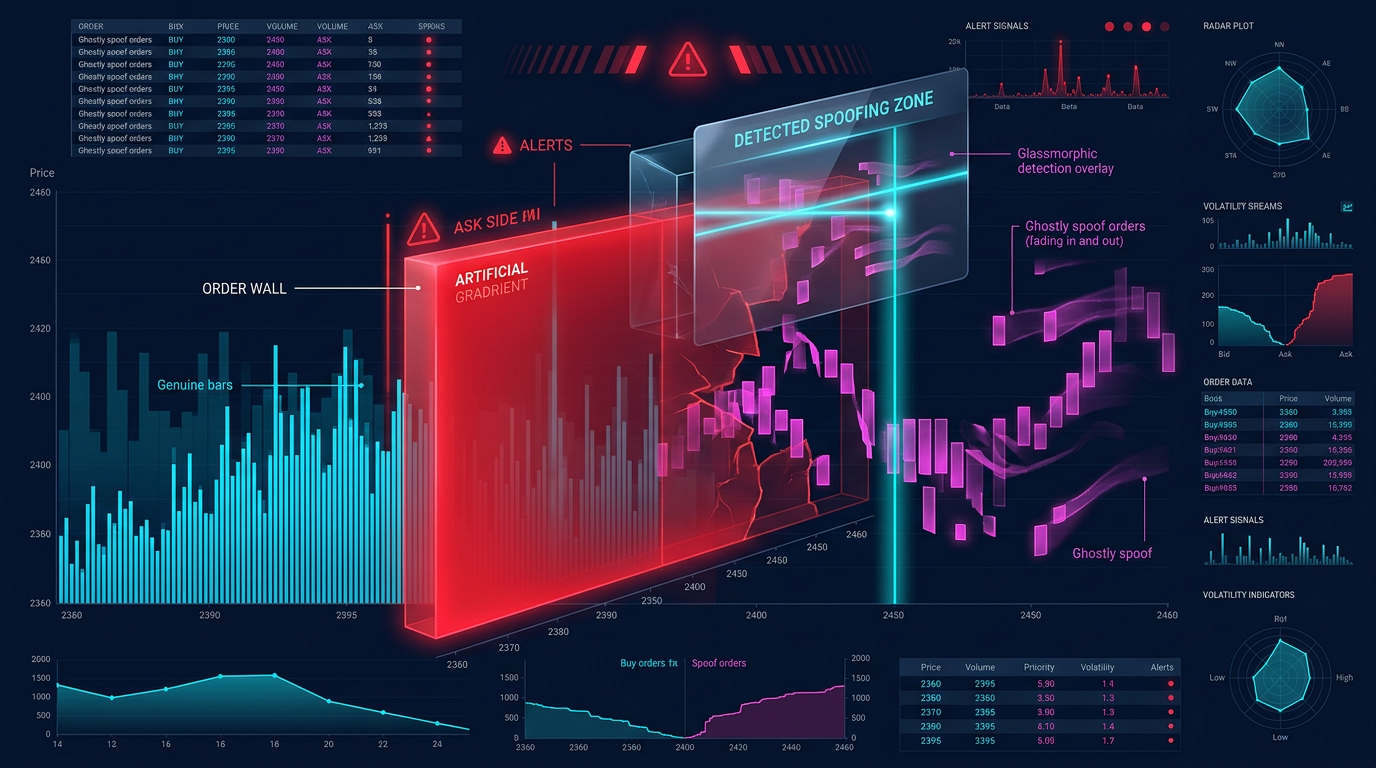 Detecting fake walls: genuine orders vs spoofing blocks with high cancel rates
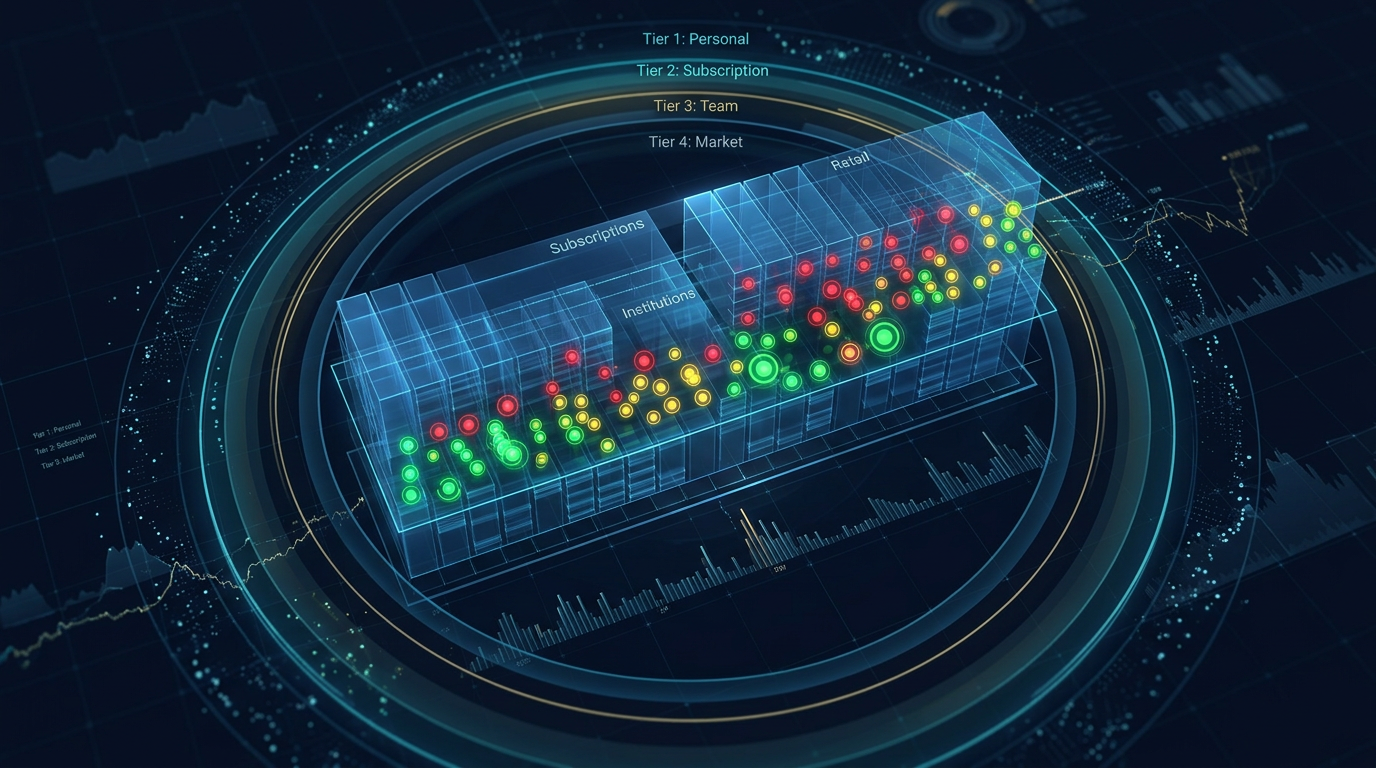 Three-tier visibility model: personal orders, subscriptions, and team positions inside the wall