How to Catch Drops After Shitcoin Pumps: A Systematic Approach
Every crypto trader has seen this at least once: a token nobody heard of yesterday does +800% in 4 hours. Twitter explodes with rocket emojis. Reddit fills up with "it's just the beginning" posts. Your colleague — who a month ago couldn't tell an order book from a McDonald's order — texts you "bro, throw at least a hundred bucks in." Twelve hours later, the token has lost 85% from its peak. Silence. Rockets deleted.
The question is not whether there will be a dump. The question is how to systematically profit from it without getting crushed by the pump itself.
This article is not financial advice (the mandatory disclaimer nobody reads, but the lawyers insist on). It's a technical breakdown of mechanics, signals, and algorithms for identifying reversal points after impulse moves on low-liquidity assets.
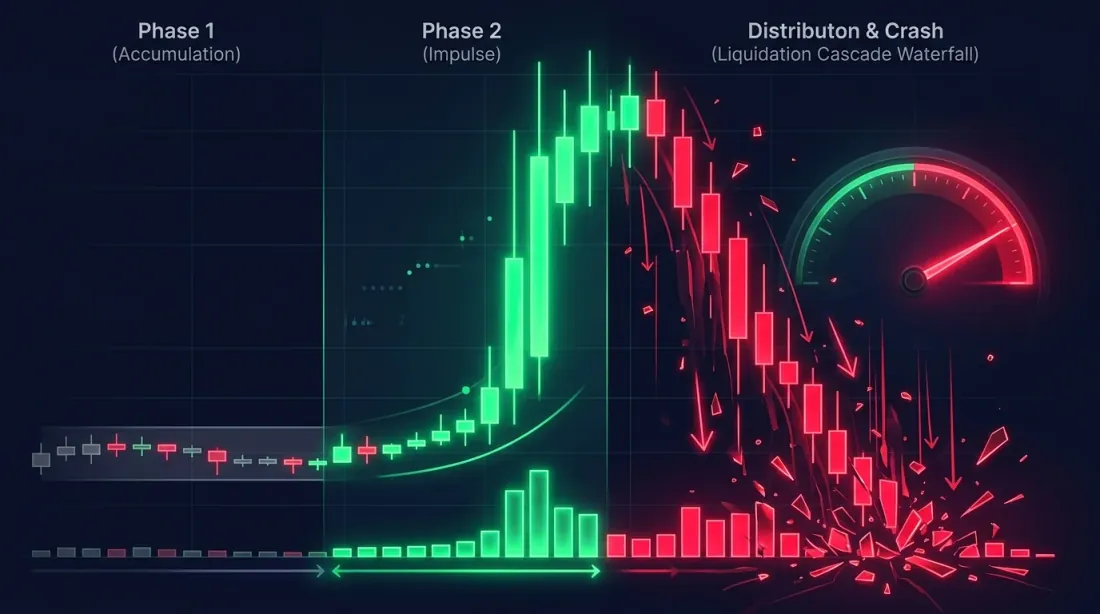
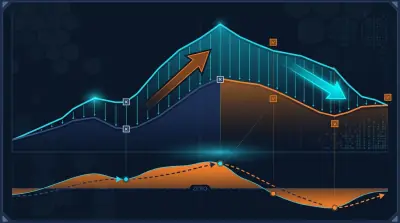
Anatomy of a Pump-and-Dump: Three Phases of One Madness
Before shorting, you need to understand the structure of the phenomenon. Every shitcoin pump-and-dump goes through three phases, each with its own characteristic data signatures.
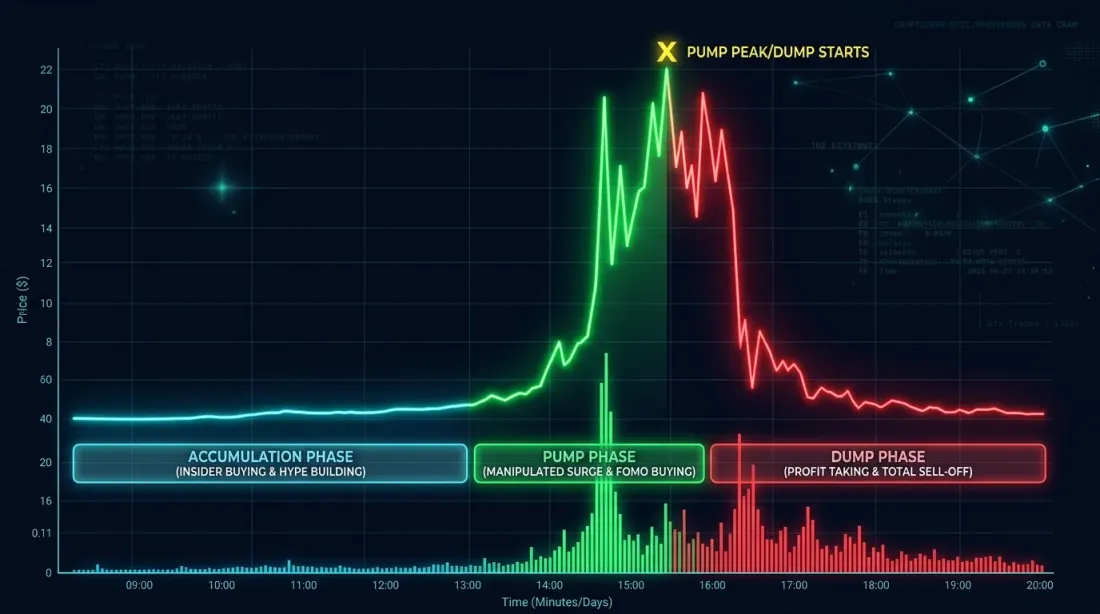
Phase 1: Accumulation (The Quiet Hunt)
Duration: from several hours to several days.
Someone — a group of insiders, a coordinated Telegram group, or simply a large player with an information edge — starts buying up the token. It's done carefully: small orders, across multiple exchanges, often during the Asian session (when liquidity is minimal and attention is scattered).
What's visible in the data:
- Trading volume gradually increases (50-200% above the 7-day average), but the price barely moves
- The bid side of the order book thickens: "walls" appear 2-5% below the current price
- On-chain metrics (for DEX tokens): large transfers to exchanges, growth in unique buyer wallets
- Funding rate on perpetual futures (if they exist) begins to slightly increase
At this phase, it's too early to short. You don't yet know whether this is accumulation or organic interest. Distinguishing one from the other is often impossible — the difference only becomes obvious in hindsight.
Phase 2: The Impulse (The Party)
Duration: from 30 minutes to 12 hours.
Price breaks through a key resistance level, and a cascade begins. Short-sellers' stop-losses get liquidated. FOMO (Fear Of Missing Out) sucks in retail traders. Crypto Twitter becomes an echo chamber. Every retweet is a new 50x leveraged long.
Characteristic signatures:
- Volume is 1000-5000% above average (not a typo)
- Funding rate rockets to 0.1-0.5% per 8 hours (normal is 0.01%)
- Open Interest grows exponentially: new positions are opened faster than they're closed
- Bid-ask spread widens 3-10x due to lack of ask-side liquidity
- The order book shows a vacuum above: between the current price and the nearest significant ask — emptiness
Shorting during this phase is suicide. It's like standing in front of a train because "it'll stop eventually." Yes, it will stop. But by that point, you'll already be liquidated. More on this below in the "What NOT to Do" section.
Phase 3: Distribution and Crash (The Hangover)
Duration: from 2 to 48 hours.
Insiders start taking profits. The price makes its first meaningful correction (-15-30% from the peak). Retail traders "buy the dip." The price bounces. Then drops again. Each subsequent bounce is weaker. Each drop is deeper.
What's happening in the data:
- Volume remains high but shifts toward the sell side
- Funding rate starts declining but is still abnormally high
- Open Interest stops growing or begins falling (longs closing)
- Large market sell orders appear, "eating through" the order book several levels down
- On-chain: large transfers from insider wallets to exchanges
This is the hunting zone. This is where the work begins.
Key Signals for Entering a Short
Each signal alone is weak. A combination of three or more is already a viable hypothesis.
1. Funding Rate: The Tax on Greed
Funding rate is the cost of holding a position on perpetual futures. When everyone wants to be long, longs pay shorts. The higher the rate, the more the market is skewed to one side.
| Funding Rate (per 8h) | Interpretation | Action |
|---|---|---|
| 0.01% | Normal | Nothing |
| 0.03-0.05% | Elevated demand for longs | Watch |
| 0.05-0.1% | Strong skew | Ready to short |
| 0.1-0.3% | Extreme skew | Actively seeking entry |
| > 0.3% | Madness | Short with confirmation |
Why this works: at a 0.3% funding rate per 8 hours, longs pay ~1% per day just for holding their position. At 10x leverage, that's 10% of capital per day. This can't last long — positions start closing, pushing the price down.
Caveat: extreme funding alone is not a short signal. It can remain high for hours or even days while the price keeps rising. Funding is a filter (confirmation of skew), not a trigger (entry point).
def funding_rate_signal(
    current_rate: float,
    historical_rates: list[float],
    lookback: int = 90,  # 90 periods = 30 days
) -> dict:
    """
    Assess the anomaly level of the current funding rate.

    Returns:
        signal: 'neutral' | 'elevated' | 'extreme' | 'insane'
        z_score: float — deviation from the norm
        percentile: float — percentile in historical data
    """
    import numpy as np

    hist = np.array(historical_rates[-lookback:])
    mean = hist.mean()
    std = hist.std()

    z_score = (current_rate - mean) / std if std > 0 else 0
    percentile = np.searchsorted(np.sort(hist), current_rate) / len(hist)

    if z_score > 4:
        signal = 'insane'
    elif z_score > 3:
        signal = 'extreme'
    elif z_score > 2:
        signal = 'elevated'
    else:
        signal = 'neutral'

    return {
        'signal': signal,
        'z_score': round(z_score, 2),
        'percentile': round(percentile, 4),
        'annualized_cost': round(current_rate * 3 * 365 * 100, 1),  # % annualized
    }
2. Open Interest: Who's Trapped
Open Interest (OI) is the total number of open contracts in futures. When OI rises alongside price — new participants are entering the market (mostly longs). When price starts falling but OI stays high — those longs are trapped. Their liquidations will fuel the dump.
Key patterns:
| Price | OI | Interpretation |
|---|---|---|
| Rising | Rising | New longs entering (pump in progress) |
| Rising | Falling | Shorts closing (short squeeze) |
| Falling | High | Longs trapped (dump potential) |
| Falling | Falling | Longs closing (dump in progress) |
The most dangerous moment for longs and the best for shorts: price has started falling, but OI is still at its maximum. This means open longs haven't closed yet — they're hoping for a bounce. When that hope runs out, the liquidation cascade begins.
def oi_divergence_signal(
    prices: list[float],
    oi_values: list[float],
    window: int = 12,  # 12 candles (e.g., 12 x 5 min = 1 hour)
) -> dict:
    """
    Detect price/OI divergence.

    Bullish OI divergence: price falling, OI high — longs are trapped.
    """
    import numpy as np

    recent_prices = np.array(prices[-window:])
    recent_oi = np.array(oi_values[-window:])

    price_change = (recent_prices[-1] - recent_prices[0]) / recent_prices[0]
    oi_change = (recent_oi[-1] - recent_oi[0]) / recent_oi[0]

    oi_at_peak = recent_oi[-1] > np.percentile(oi_values, 90)
    price_declining = price_change < -0.03  # price dropped by 3%+

    trapped_longs = oi_at_peak and price_declining

    if len(oi_values) > window * 2:
        oi_velocity = oi_change / max(abs(price_change), 0.001)
    else:
        oi_velocity = 0

    return {
        'trapped_longs': trapped_longs,
        'oi_percentile': round(
            np.searchsorted(np.sort(oi_values), recent_oi[-1]) / len(oi_values), 2
        ),
        'price_change': round(price_change * 100, 2),
        'oi_change': round(oi_change * 100, 2),
        'oi_velocity': round(oi_velocity, 2),
    }
3. Volume Analysis: The Truth in Ticks
Volume is the only market indicator that can't be faked (well, almost — wash trading on some exchanges is still a reality, but top venues have gotten better at fighting it).
Signals for shorting:
Declining volume on rallies. A classic sign of weakness. Price makes a new high, but volume on that move is lower than the previous one. Buyers are running out of steam.
Volume spike on drops. If a -10% correction happens on volume exceeding the last rally's volume — sellers have seized the initiative.
Fake breakout with low volume. Price breaks a local high, but breakout volume is 2-3 times below average. This is a trap for buyers: price quickly returns.
def volume_exhaustion_signal(
    candles: list[dict],  # [{open, high, low, close, volume, timestamp}, ...]
    pump_start_idx: int,
) -> dict:
    """
    Volume exhaustion analysis after a pump.
    """
    import numpy as np

    pump_candles = candles[pump_start_idx:]

    up_candles = [c for c in pump_candles if c['close'] > c['open']]
    down_candles = [c for c in pump_candles if c['close'] <= c['open']]

    if not up_candles or not down_candles:
        return {'signal': 'insufficient_data'}

    avg_up_vol = np.mean([c['volume'] for c in up_candles])
    avg_down_vol = np.mean([c['volume'] for c in down_candles])

    up_volumes = [c['volume'] for c in up_candles]
    if len(up_volumes) >= 3:
        first_half = np.mean(up_volumes[:len(up_volumes)//2])
        second_half = np.mean(up_volumes[len(up_volumes)//2:])
        volume_degradation = (second_half - first_half) / first_half
    else:
        volume_degradation = 0

    all_volumes = np.array([c['volume'] for c in candles])
    vol_mean = all_volumes[:-len(pump_candles)].mean() if len(candles) > len(pump_candles) else all_volumes.mean()
    vol_std = all_volumes[:-len(pump_candles)].std() if len(candles) > len(pump_candles) else all_volumes.std()
    current_z = (pump_candles[-1]['volume'] - vol_mean) / vol_std if vol_std > 0 else 0

    return {
        'sell_buy_volume_ratio': round(avg_down_vol / max(avg_up_vol, 1), 2),
        'volume_degradation_pct': round(volume_degradation * 100, 1),
        'current_volume_z_score': round(current_z, 2),
        'signal': 'exhaustion' if volume_degradation < -0.3 else 'active',
    }
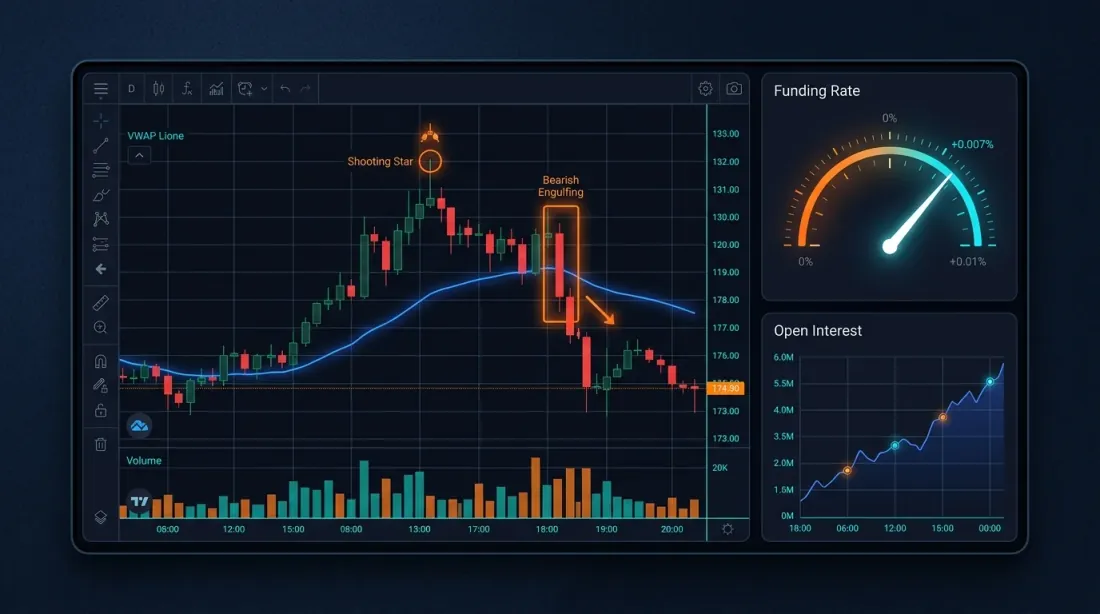
4. Candlestick Patterns: Old School That Works
Yes, candlestick analysis dates back to the 17th century, Munehisa Homma and rice futures. Yes, 90% of "candlestick strategies" on YouTube are garbage. But on 5-minute and 15-minute timeframes after a pump, certain patterns have statistically significant predictive power. The reason is simple: they reflect real microstructure — the handoff of control from buyers to sellers.
Patterns worth tracking:
| Pattern | Description | Reliability after pump |
|---|---|---|
| Shooting Star | Long upper shadow, small body at bottom | High |
| Bearish Engulfing | Red candle fully envelops previous green one | High |
| Evening Star | 3 candles: big green -> small (doji) -> big red | Very high |
| Gravestone Doji | Open = close at bottom, long upper shadow | Medium |
| Three Black Crows | Three consecutive red candles with descending closes | High (confirmation) |
Critically important: a pattern without context is noise. A Shooting Star on a random pullback means nothing. A Shooting Star at the pump peak with anomalous funding rate and OI divergence — that's a completely different story.
def detect_reversal_patterns(
    candles: list[dict],
    min_upper_shadow_ratio: float = 2.0,  # shadow > 2x body for shooting star
) -> list[dict]:
    """
    Detect bearish reversal patterns.
    """
    signals = []

    for i in range(2, len(candles)):
        c = candles[i]
        body = abs(c['close'] - c['open'])
        upper_shadow = c['high'] - max(c['close'], c['open'])
        lower_shadow = min(c['close'], c['open']) - c['low']
        total_range = c['high'] - c['low']

        if total_range == 0:
            continue

        if (upper_shadow > body * min_upper_shadow_ratio
            and lower_shadow < body * 0.5
            and c['close'] < c['open']):  # bearish
            signals.append({
                'pattern': 'shooting_star',
                'index': i,
                'timestamp': c['timestamp'],
                'strength': upper_shadow / total_range,
            })

        prev = candles[i - 1]
        if (prev['close'] > prev['open']  # previous is bullish
            and c['close'] < c['open']      # current is bearish
            and c['open'] > prev['close']   # opens above previous close
            and c['close'] < prev['open']): # closes below previous open
            signals.append({
                'pattern': 'bearish_engulfing',
                'index': i,
                'timestamp': c['timestamp'],
                'strength': body / (abs(prev['close'] - prev['open']) + 1e-10),
            })

        if i >= 2:
            c1 = candles[i - 2]
            c2 = candles[i - 1]
            c3 = candles[i]

            c1_body = abs(c1['close'] - c1['open'])
            c2_body = abs(c2['close'] - c2['open'])
            c3_body = abs(c3['close'] - c3['open'])

            if (c1['close'] > c1['open']        # first is bullish
                and c2_body < c1_body * 0.3      # second is small (doji)
                and c3['close'] < c3['open']     # third is bearish
                and c3_body > c1_body * 0.5      # third is large enough
                and c3['close'] < c1['close']):  # third closes below first's close
                signals.append({
                    'pattern': 'evening_star',
                    'index': i,
                    'timestamp': c['timestamp'],
                    'strength': c3_body / c1_body,
                })

    return signals
5. VWAP: The Anchor of Reality
VWAP (Volume-Weighted Average Price) is the volume-weighted average price. Anchored VWAP from the start of the pump shows the average entry price for all participants who bought during the impulse.
Why this matters: when price drops below anchored VWAP — the average buyer is underwater. Psychological pressure builds. Those who bought "cheap" (at the start of the pump) begin taking profits. Those who bought at the peak — are panicking.
Rule: a break below anchored VWAP on elevated volume is a strong signal for shorting or adding to a position.
def anchored_vwap(
    candles: list[dict],
    anchor_idx: int,
) -> list[float]:
    """
    Calculate Anchored VWAP from a given point (start of pump).
    """
    vwap_values = []
    cum_vol = 0
    cum_vol_price = 0

    for i in range(anchor_idx, len(candles)):
        c = candles[i]
        typical_price = (c['high'] + c['low'] + c['close']) / 3
        cum_vol += c['volume']
        cum_vol_price += typical_price * c['volume']

        vwap = cum_vol_price / cum_vol if cum_vol > 0 else typical_price
        vwap_values.append(vwap)

    return vwap_values
6. Liquidation Cascades: The Domino Effect
This is the most powerful dump mechanism — and the most profitable one for shorts. The logic is simple:
- A trader opens a 20x leveraged long. Liquidation triggers if price drops 5%.
- Price drops 5%. Position is liquidated — the exchange market-sells.
- The market sell pushes price lower. This liquidates the next trader.
- And so on. Cascade.
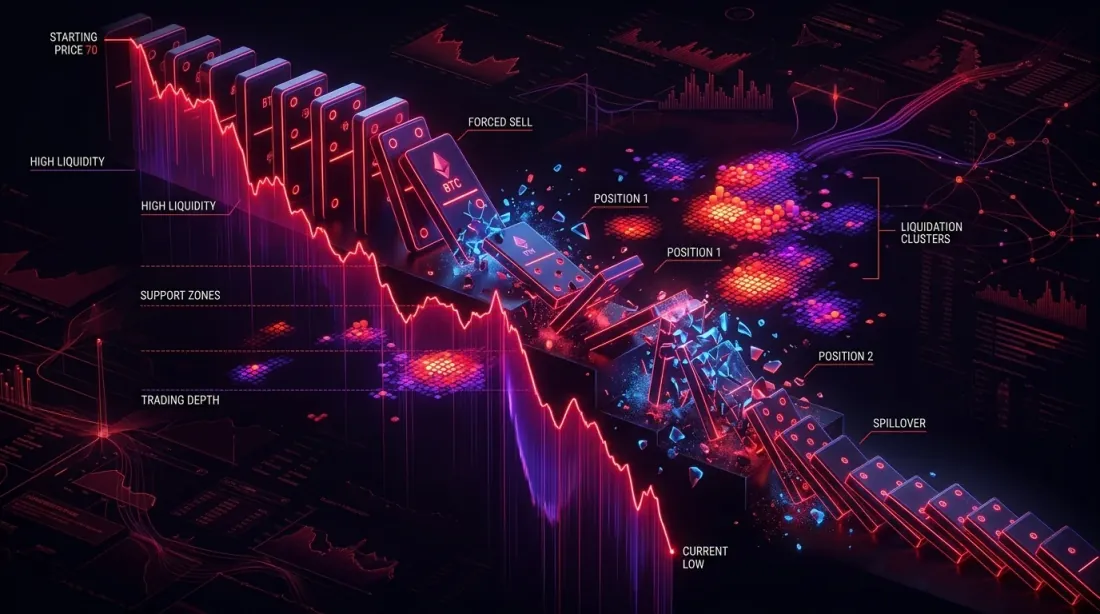
How to see this coming:
CoinGlass Liquidation Heatmap shows where liquidation levels are concentrated. If below the current price you see a "wall" of liquidations — a drop to that level will most likely trigger a cascade.
| Tool | What it shows | URL |
|---|---|---|
| CoinGlass Heatmap | Liquidation levels on the price chart | coinglass.com/liq/BTC |
| CoinGlass OI | Open Interest by exchange | coinglass.com/open-interest |
| CoinGlass Funding | Funding rates by exchange | coinglass.com/funding-rate |
| Coinalyze | OI + volume + liquidations | coinalyze.net |
| Hyblock Capital | Liquidation levels | hyblock.co |
Cascade signal: if in the zone -5% to -15% from the current price there is more than 50-200M) — a cascade is likely.
Practical Algorithm: Filter -> Entry -> Risk
Theory is wonderful. Now — the pipeline.
Step 1: Filtering (Scanner)
From thousands of tokens, you need to isolate those in the post-pump phase. Criteria:
def pump_scanner(
    symbols: list[str],
    exchange,  # ccxt exchange instance
    lookback_hours: int = 24,
    min_pump_pct: float = 100,  # minimum +100% over lookback
    min_volume_z: float = 3,    # volume Z-score > 3
) -> list[dict]:
    """
    Scanner for tokens in the post-pump phase.
    """
    import numpy as np

    candidates = []

    for symbol in symbols:
        try:
            candles = exchange.fetch_ohlcv(symbol, '1h', limit=168)  # 7 days
            if len(candles) < 168:
                continue

            closes = [c[4] for c in candles]
            volumes = [c[5] for c in candles]

            recent_closes = closes[-lookback_hours:]
            max_price = max(recent_closes)
            min_price_before = min(closes[:-lookback_hours]) if len(closes) > lookback_hours else closes[0]
            pump_pct = (max_price - min_price_before) / min_price_before * 100

            current_price = closes[-1]
            drawdown_from_peak = (current_price - max_price) / max_price * 100

            vol_baseline = np.mean(volumes[:-lookback_hours])
            vol_std = np.std(volumes[:-lookback_hours])
            vol_recent = np.mean(volumes[-lookback_hours:])
            vol_z = (vol_recent - vol_baseline) / vol_std if vol_std > 0 else 0

            if pump_pct >= min_pump_pct and vol_z >= min_volume_z:
                candidates.append({
                    'symbol': symbol,
                    'pump_pct': round(pump_pct, 1),
                    'drawdown_from_peak': round(drawdown_from_peak, 1),
                    'volume_z_score': round(vol_z, 2),
                    'current_price': current_price,
                    'peak_price': max_price,
                })
        except Exception:
            continue

    candidates.sort(key=lambda x: x['drawdown_from_peak'], reverse=True)
    return candidates
Step 2: Signal Convergence (Scoring)
For each candidate — evaluation across all six parameters:
def confluence_score(
    funding_signal: dict,
    oi_signal: dict,
    volume_signal: dict,
    pattern_signals: list[dict],
    vwap_position: float,  # price / VWAP (< 1 = below VWAP)
    liquidation_density: float,  # $M liquidations below current price
) -> dict:
    """
    Composite score for short entry.
    Score 0-6, where each factor = 0 or 1 point.
    """
    score = 0
    reasons = []

    if funding_signal['signal'] in ('extreme', 'insane'):
        score += 1
        reasons.append(f"Funding z-score: {funding_signal['z_score']}")

    if oi_signal['trapped_longs']:
        score += 1
        reasons.append(f"Trapped longs: OI percentile {oi_signal['oi_percentile']}")

    if volume_signal['signal'] == 'exhaustion':
        score += 1
        reasons.append(f"Volume degradation: {volume_signal['volume_degradation_pct']}%")

    strong_patterns = [p for p in pattern_signals if p['strength'] > 0.6]
    if strong_patterns:
        score += 1
        reasons.append(f"Pattern: {strong_patterns[-1]['pattern']}")

    if vwap_position < 0.98:  # price 2%+ below VWAP
        score += 1
        reasons.append(f"Below VWAP: {round((1 - vwap_position) * 100, 1)}%")

    if liquidation_density > 5:  # > $5M liquidations
        score += 1
        reasons.append(f"Liquidation density: ${liquidation_density}M")

    if score >= 4:
        action = 'strong_short'
    elif score >= 3:
        action = 'short'
    elif score >= 2:
        action = 'watch'
    else:
        action = 'skip'

    return {
        'score': score,
        'max_score': 6,
        'action': action,
        'reasons': reasons,
    }
Step 3: Entry and Risk Management
Entry:
- Score >= 4: enter with 50% of position
- Score = 3: enter with 25% of position
- Score < 3: wait
Stop-loss:
- Above the last swing high + 1-2% buffer
- NOT a tight stop. Volatility on shitcoins will kill you. Minimum 5-10% from entry.
- At Score = 6, a stop of 8-12% is acceptable (more confidence = wider stop, but less leverage)
Take-profit:
- TP1 (50% of position): next major support level or -20% from entry
- TP2 (30% of position): VWAP from the start of the pump
- TP3 (20% of position): pre-pump level
Position size:
With $10,000 capital, 2% risk per trade, and an 8% stop:
With 3x leverage: you risk 500-$1,250 (TP1-TP3).
Maximum leverage: 3-5x. No more. Seriously. Shitcoins in the pump phase can do another +50% after "all indicators said short." High leverage = liquidation.
What NOT to Do: Five Deadly Sins
1. Do NOT short during the pump
"But it's definitely going to drop!" — yes, it will drop. But when? If you entered a short at +200% and the price did +600% before falling to +150% — you were liquidated at +450%. Technically you were right. Practically — bankrupt.
Rule: enter only after the first significant pullback (-15% or more from the peak) and formation of a reversal structure.
2. Do NOT use tight stop-losses
A 2% stop-loss on a shitcoin with 15% ATR is not risk management — it's charity to market makers. Your stop will be hit within minutes during the next volatile wick.
Rule: stop-loss >= 1.5 x ATR of the current timeframe. Ideally 2x.
3. Do NOT bet everything on one trade
Even with a Score of 6/6, the probability of success is around 65-70%. This means 3 out of 10 trades are losers. If you put 10% of capital on each — three consecutive losses = -30% drawdown. After that, you'll psychologically start trading worse.
Rule: 1-2% of capital per trade. Maximum 5% with extreme conviction.
4. Do NOT ignore liquidity
You're not Goldman Sachs. If a token's daily volume is 50K — you become the market event. Your entry moves the price, your exit moves the price. Slippage eats all the profit.
Rule: position size <= 1% of the token's daily volume.
5. Do NOT short on spot markets without short capability
This seems obvious, but the number of people who "short" by buying inverse tokens on a DEX or by "selling spot they planned to buy back cheaper" is staggering. Use futures on exchanges with proper liquidity. Or don't short at all.
Monitoring Tools
CoinGlass (coinglass.com)
The primary tool for futures analysis:
- Liquidation Heatmap: visualization of liquidation levels on the price chart
- Funding Rate: comparison of funding rates across exchanges in real time
- Open Interest: aggregated OI by exchange
- Long/Short Ratio: ratio of longs to shorts (by account count and by volume)
Coinalyze (coinalyze.net)
Deep derivatives analytics:
- Aggregated OI: combined Open Interest broken down by exchange
- Liquidations: liquidation history broken down by long/short
- OI-weighted Funding Rate: more accurate funding rate accounting for each exchange's share
TradingView (tradingview.com)
For chart analysis:
- Pine Script for automating candlestick patterns
- Anchored VWAP (built-in tool)
- CoinGlass data overlay via community indicators
Laevitas (laevitas.ch)
Professional derivatives terminal:
- Gamma exposure
- Options flow
- OI heatmap by strike
Automation with AI Agents
Everything described above can (and should) be automated. Here's the detection system architecture:
import asyncio
import numpy as np
from dataclasses import dataclass
from enum import Enum

class AlertLevel(Enum):
    WATCH = "watch"
    PREPARE = "prepare"
    ENTRY = "entry"

@dataclass
class PumpDumpAlert:
    symbol: str
    level: AlertLevel
    score: int
    reasons: list[str]
    suggested_entry: float | None
    suggested_stop: float | None
    suggested_tp: list[float]
    timestamp: float

class PumpDumpDetector:
    """
    AI agent for detecting post-pump dumps.

    Pipeline:
    1. Scanning: volume Z-score > 3 + price increase > 100%
    2. Filtering: funding spike + OI growth
    3. Waiting: reversal pattern on 5m/15m
    4. Alert: scoring -> notification
    """

    def __init__(
        self,
        exchange,
        symbols: list[str],
        volume_z_threshold: float = 3.0,
        funding_z_threshold: float = 2.0,
        min_pump_pct: float = 80.0,
        scan_interval_sec: int = 60,
    ):
        self.exchange = exchange
        self.symbols = symbols
        self.volume_z_threshold = volume_z_threshold
        self.funding_z_threshold = funding_z_threshold
        self.min_pump_pct = min_pump_pct
        self.scan_interval_sec = scan_interval_sec
        self.active_watches: dict[str, dict] = {}

    async def scan_loop(self):
        """Main scanning loop."""
        while True:
            candidates = await self._broad_scan()

            for candidate in candidates:
                symbol = candidate['symbol']

                if symbol not in self.active_watches:
                    self.active_watches[symbol] = {
                        'first_seen': asyncio.get_event_loop().time(),
                        'pump_peak': candidate['peak_price'],
                        'pump_start_approx': candidate.get('pump_start_price'),
                    }
                    await self._emit_alert(PumpDumpAlert(
                        symbol=symbol,
                        level=AlertLevel.WATCH,
                        score=0,
                        reasons=[f"Pump detected: +{candidate['pump_pct']}%"],
                        suggested_entry=None,
                        suggested_stop=None,
                        suggested_tp=[],
                        timestamp=asyncio.get_event_loop().time(),
                    ))

                analysis = await self._deep_analysis(symbol)

                if analysis['score'] >= 3:
                    entry = candidate['current_price']
                    stop = candidate['peak_price'] * 1.02  # 2% above peak

                    await self._emit_alert(PumpDumpAlert(
                        symbol=symbol,
                        level=AlertLevel.ENTRY if analysis['score'] >= 4 else AlertLevel.PREPARE,
                        score=analysis['score'],
                        reasons=analysis['reasons'],
                        suggested_entry=entry,
                        suggested_stop=stop,
                        suggested_tp=[
                            entry * 0.80,  # TP1: -20%
                            entry * 0.65,  # TP2: -35%
                            entry * 0.50,  # TP3: -50%
                        ],
                        timestamp=asyncio.get_event_loop().time(),
                    ))

            current_time = asyncio.get_event_loop().time()
            self.active_watches = {
                s: d for s, d in self.active_watches.items()
                if current_time - d['first_seen'] < 48 * 3600
            }

            await asyncio.sleep(self.scan_interval_sec)

    async def _broad_scan(self) -> list[dict]:
        """Quick scan of all symbols."""
        ...

    async def _deep_analysis(self, symbol: str) -> dict:
        """
        Deep analysis of a specific symbol.
        Collects all 6 signals and computes confluence score.
        """
        funding = await self._get_funding_signal(symbol)

        oi = await self._get_oi_signal(symbol)

        volume = await self._get_volume_signal(symbol)

        patterns = await self._get_pattern_signals(symbol, timeframe='5m')

        vwap_pos = await self._get_vwap_position(symbol)

        liq_density = await self._get_liquidation_density(symbol)

        return confluence_score(
            funding, oi, volume, patterns, vwap_pos, liq_density
        )

    async def _emit_alert(self, alert: PumpDumpAlert):
        """Send alert (Telegram, webhook, etc.)."""
        print(f"[{alert.level.value.upper()}] {alert.symbol} "
              f"Score: {alert.score}/6 | {', '.join(alert.reasons)}")
        ...
Key Thresholds for Automation
| Parameter | WATCH threshold | ENTRY threshold |
|---|---|---|
| Volume Z-score | > 3 | > 5 |
| Funding Rate Z-score | > 2 | > 3 |
| OI growth over 4h | > 50% | > 100% |
| Price from peak | -5% to -15% | -15% to -30% |
| Candlestick pattern | Any | Strong (strength > 0.6) |
| Price vs VWAP | Near VWAP | Below by 2%+ |
Statistics and Reality
Let's be honest. This strategy is not the holy grail. Here are approximate backtest statistics on 2024-2025 data:
| Metric | Value |
|---|---|
| Win rate (score >= 4) | ~62-68% |
| Average win | +18-25% |
| Average loss | -8-12% |
| Profit factor | 1.8-2.3 |
| Max drawdown | -15-22% |
| Sharpe ratio | 1.1-1.6 |
Key limitations:
-
Survivorship bias: we only analyze tokens traded on futures exchanges. The wildest pump-and-dumps happen on DEXes, where shorting is impossible.
-
Liquidity: on many shitcoin futures, there isn't enough liquidity for a meaningful position size. Slippage can eat 2-5% of profits.
-
Fighting market makers: professional MMs know these patterns and actively use them to hunt short-sellers' stop-losses. A fake pump after a reversal pattern forms — that's a standard play.
-
Black swan on shorts: theoretically, a short has unlimited loss potential. In practice, a stop-loss solves the problem — but during low-liquidity moments, the stop can fill significantly worse than the specified price.
Conclusion
Shorting dumps after shitcoin pumps is one of the few strategies in crypto where an edge (statistical advantage) genuinely exists. The reason: mass irrationality of retail traders creates predictable patterns, and the mechanics of liquidation cascades amplify the move in your direction.
Three rules to take away:
-
Never short the impulse. Wait for Phase 3. Wait for reversal patterns. Wait for OI divergence. Patience is your primary tool, not some clever indicator.
-
Use signal convergence. One indicator is noise. Two is a hypothesis. Four or more is a tradeable setup. Funding + OI + pattern + VWAP = entry.
-
Manage position size, not leverage. 2% risk per trade, 3-5x leverage maximum, stop-loss >= 1.5 ATR. Boring? Yes. But boring traders are the only ones still in the market a year later.
And one last thing. Remember: behind every dump, there are real people who lost real money. Many of them are beginners who succumbed to FOMO. We analyze market mechanics, not advocate for manipulation. Profiting from inefficiency is legitimate. Creating that inefficiency is not.
For more on funding rates and their impact on leverage, see our article Funding Rates Kill Your Leverage. On anomaly detection methods in trading — Anomaly Detection for Protecting Trading Bots. On funding rate arbitrage between exchanges — Cross-Exchange Funding Rate Arbitrage.
Useful Links
- CoinGlass — Liquidation Heatmap
- CoinGlass — Funding Rate
- CoinGlass — Open Interest
- Coinalyze — Aggregated Open Interest
- Hyblock Capital — Liquidation Levels
- Laevitas — Derivatives Analytics
- TradingView — Anchored VWAP
- Binance — Funding Rate History
Citation
@article{soloviov2026shitcoinpumpdump,
  author = {Soloviov, Eugen},
  title = {How to Catch Drops After Shitcoin Pumps: A Systematic Approach},
  year = {2026},
  url = {https://marketmaker.cc/en/blog/post/shitcoin-pump-dump-strategies},
  version = {0.1.0},
  description = {A systematic breakdown of shorting strategies after shitcoin pumps. Funding rate, OI, volume analysis, candlestick patterns, liquidation cascades. With a practical algorithm.}
}
MarketMaker.cc Team
Сандык изилдөөлөр жана стратегия
Read More
Statistical Arbitrage and Pairs Trading in Crypto Markets: From Cointegration to the Kalman Filter
Funding Rates Kill Your Leverage: Why PnL×50x Is a Fiction