뉴스레터를 구독하여 독점적인 AI 트레이딩 통찰력, 시장 분석 및 플랫폼 업데이트를 받아보세요.
Algorithmic Core: A holographic glossary mapping the interconnected terminology of high-frequency quantitative systems.
Core Components
Trading Entities
Exchange - a platform for trading cryptocurrencies (e.g., Binance, Kraken)
Market - a specific market on an exchange, such as futures or spot
Pair - an abstract pair of traded assets, e.g., BTC/USDT, not tied to a specific exchange
Instrument - a specific trading pair tied to a specific market (and therefore a specific exchange)
Analytical Components
Portfolio - a virtual wallet with assets, tracks balance and positions
Metric - a component for generating metrics. Example: difference between opening and closing prices
Signal - a component for generating signals based on metrics. Example: if open > close, then buy; if open < close, then sell
Trading Components
Strategy - takes a signal as input and outputs instructions for the bot
Bot - code that knows how to trade based on a signal or without one
Bot Instance - an instance of a bot that takes a strategy and portfolio as input and generates trading orders
Basic Definitions
Exchange
A platform for trading assets that enables buying and selling. Examples include "binance", "bybit", and "okx".
Market Type
Types of markets that can be represented on exchanges. Example: "spot" (spot market), "futures" (futures market).
Market
A specific type of market on an exchange, such as spot, futures, or margin trading. Example: "binance/spot"
Pair (Trading Pair)
A trading pair consists of two parts: baseId/quoteId
baseId - base currency (what is bought/sold)
quoteId - quote currency (in which the price is denominated)
Examples:
BTC/USDT: baseId=BTC, quoteId=USDT (price in USDT)
TON/BTC: baseId=TON, quoteId=BTC (price in BTC)
LTC/BNB: baseId=LTC, quoteId=BNB (price in BNB)
For calculating wall volume in USDT:
If quoteId is USDT - volume is calculated directly (price * amount)
For any pair baseId/quoteId:
Take bestBid from the baseId/USDT orderbook
Volume in USDT = (price * amount) * bestBid_baseId_USDT
After calculating the volume in USDT, we can compare it with min_usdt to find significant walls.
Instrument
A specific trading pair tied to a market. Example: "BTC/USDT/binance/spot" (BTC/USDT on Binance Spot Market).
Portfolio
A virtual wallet containing assets that can be used for trading.
Metric
A component that generates metrics based on market data (e.g., the difference between opening and closing prices).
Signal
A signal is a discrete event or state that has:
A clear start (timestampStart)
A possible end (timestampEnd)
Specific parameters
Examples of signals:
Trading signal: "Buy BTC/USDT now at a price of 40000"
Trend signal: "BTC/USDT is in a sideways movement from 12:00 to 14:00"
Important: do not confuse signals with metrics. A metric is a continuous series of data (e.g., a price chart or indicator), while a signal is a specific event or state at a particular moment or period of time.
Signals can:
Be generated based on metric analysis
Be converted into metrics for visualization
Form a history for subsequent analysis
Strategy
Takes signals as input and outputs instructions for the trading bot.
Bot
Code that knows how to perform trading operations based on signals or other predefined logical rules.
Bot Instance
A running instance of a bot that generates trading orders based on a strategy and portfolio.
Density (alternative: Wall)
In the context of an orderbook, "density" or "wall" is the volume of orders at a specific price level.
Examples:
Buy wall (bids density) - a large volume of buy orders at a certain price level. For example, if there are buy orders for BTC at a price of 40000 USDT with a total volume of 1000000 USDT, this is a large "wall" of buyers. To break through this wall downward (for the price to fall below 40000), one would need to sell BTC worth more than 1000000 USDT.
Sell wall (asks density) - a large volume of sell orders at a certain price level.
Calculating the maximum wall:
Take midPrice as the base price
Define the search range: midPrice ± (midPrice * look_in_percent)
Within this range, search for:
For bids: the first order from midPrice downward where the volume in USDT > min_usdt
For asks: the first order from midPrice upward where the volume in USDT > min_usdt
For each wall found, record:
The wall volume in USDT from the orderbook
At what percentage from midPrice it is located (e.g.: -0.5% for bids or +0.7% for asks)
Notes
One Exchange can have multiple Markets
One Market can contain multiple Instruments
One Pair can be represented on different Markets as different Instruments
Signal uses Metric for market analysis
Strategy uses Signal for decision making
Bot Instance uses Strategy to generate specific trading actions
Metrics and Signals in Trading Systems
Metrics
A metric is a continuous series of data tied to a timeline (timeseries). Each metric point has a timestamp.
Types of metrics:
Simple boolean metrics - buy/sell signals
[
    [1623456789, true],   # buy
    [1623456790, false],  # no signal
    [1623456791, false],  # no signal
    [1623456792, true]    # buy
]
Numeric state metrics - e.g., market trend
[
    [1623456789, 0],   # flat
    [1623456790, -1],  # down trend
    [1623456791, 1],   # up trend
    [1623456792, 0]    # flat
]
Analysis of OHLCV metrics can generate a trend signal
Analysis of volume metrics can generate a signal about high activity
Signals can be converted into metrics for visualization
A trend signal can be converted into a spline for display on a chart
Trading signals can be converted into points on a chart
Signal history can form a metric
A sequence of buy/sell signals forms a boolean metric
A sequence of trend signals forms a market state metric
Trading Charts and Data Analysis
Candles and OHLCV
Candles (candlesticks) are a visualization tool that displays price movements over a specific period. Each candle contains OHLCV data:
O (Open) - opening price of the period
H (High) - maximum price reached during the period
L (Low) - minimum price reached during the period
C (Close) - closing price of the period
V (Volume) - total trading volume during the period
Candles aggregate individual trades that occurred during a specific time interval into a single visual element, simplifying price movement analysis. The candle structure includes:
Candle body - a rectangle showing the difference between opening and closing prices
Color - typically green (or white) for bullish candles (close > open) and red for bearish candles (close < open)
Shadows/Wicks - lines extending above and below the body, showing maximum and minimum prices
Upper shadow - line from the top of the body to the maximum price
Lower shadow - line from the bottom of the body to the minimum price
Timeframes
The time interval for which candles and OHLCV data are formed. Common timeframes include:
m1, m5, m15, m30 - 1, 5, 15, 30 minutes
h1, h4 - 1, 4 hours
d1 - 1 day
w1 - 1 week
M1 - 1 month
Timeframes allow traders to view market data with different resolutions. Shorter timeframes (e.g., m1, m5) show more details but may contain more market noise, while longer timeframes (e.g., d1, w1, M1) display broader market trends.
Candlestick Patterns
Specific combinations of candles that may indicate potential trend reversals or continuation:
Bullish Engulfing - a reversal pattern where a bullish candle completely engulfs the previous bearish candle
Hammer - a potential signal for a downtrend reversal, characterized by a small body and a long lower shadow
Doji - a candle with a very small body, indicating market indecision
Order Types and Positions
Order Types
Market Order - an order to buy or sell an asset at the current market price, executed immediately
Limit Order - an order to buy or sell an asset at a specified price or better
Stop Order - an order that activates when a certain price is reached
Stop-Limit Order - a combination of stop and limit orders
Take Profit - an order to close a position with profit when a certain price is reached
Stop Loss - an order to close a position with a loss to limit potential losses
Trailing Stop - a dynamic stop loss that follows the price when it moves in a favorable direction
OCO (One Cancels Other) - a pair of linked orders where execution of one automatically cancels the other
Iceberg Order - a large order split into a series of smaller ones to minimize market impact
Conditional Orders - orders that activate when certain conditions besides price are met
Positions
Long Position - buying an asset with the expectation of its price increasing
Short Position - selling an asset with the expectation of its price decreasing
Position Size - the number of units of an asset in a position
Margin - collateral required to open a position with leverage
Leverage - the ratio between position size and a trader's own funds
Deal
A Deal is an aggregated entity that combines trades, open positions, and open orders. If only trades remain in a deal (with no open positions or orders), such a deal is considered completed/closed.
Key parameters tracked for each deal:
Deal ID — unique identifier
Open Time — date and time of the first trade within the deal
Close Time — date and time of the last trade within the deal (if the deal is closed)
Holding Period — duration of the deal (from opening to closing)
Status — open / closed / partially closed / canceled
Deal Type — long / short / arbitrage / spread / other
Strategy — which bot initiated the deal
User — which user initiated the deal
Asset(s) — symbol(s) of traded instruments (e.g., BTC/USDT)
List of trades, positions, and orders — all trades, positions, and orders included in the deal (including canceled ones)
Financial parameters:
Input — amount of invested funds (in USDT and base currency)
Output — amount of withdrawn funds (in USDT and base currency)
Realized PnL
In absolute terms (USDT, BTC, etc.)
In percentage (relative to input)
Unrealized PnL
In absolute terms (USDT, BTC, etc.)
In percentage (relative to input)
Estimated at current market price
Expected PnL
Projected final profit/loss (e.g., if there are open positions/orders)
Final PnL
Final profit/loss after the deal is fully closed
Commissions
Total commissions (for each currency)
As a percentage of turnover
Slippage
Difference between expected and actual execution price
Turnover
Total buy/sell volume within the deal
ROI (Return on Investment)
Ratio of profit to invested funds
Maximum Drawdown
Maximum decrease in deal value relative to its peak
Additional parameters:
Comment — free-form notes
Tags — for filtering and analytics
Related deals — e.g., if part of a strategy or series of deals
Platform/Broker — where the deal was executed
Technical Analysis Indicators
Moving Average - an indicator that smooths price fluctuations to identify trends
RSI (Relative Strength Index) - an oscillator measuring the speed and change of price movements
MACD (Moving Average Convergence/Divergence) - an indicator showing the relationship between two moving averages
Bollinger Bands - a volatility indicator consisting of a moving average and two standard deviations
Momentum Indicators - Momentum, Rate of Change (ROC)
Fibonacci Levels - a technical analysis tool based on Fibonacci numbers
Elliott Waves - a theory of market cycle analysis through wave patterns
Harmonic Patterns - geometric price patterns based on Fibonacci numbers
Market Analysis Types
Technical Analysis - a method of forecasting future price movements based on studying past price changes and trading volumes. Uses charts, patterns, indicators.
Fundamental Analysis - a method of assessing an asset's intrinsic (fair) value by examining economic, financial, and other qualitative and quantitative factors. In cryptocurrencies, this may include analyzing the project, team, technology, tokenomics, community, and overall market conditions.
Sentimental Analysis - the assessment of the overall mood or attitude of market participants towards a specific asset or the market as a whole. Sources can include social media, news articles, forums, and surveys. Helps to understand if the market is "bullish" or "bearish" from a crowd psychology perspective.
Market Concepts
Market Participants
Market Maker - a market participant who provides liquidity by simultaneously placing buy and sell orders. Main functions:
Providing market liquidity
Narrowing the spread between buy and sell prices
Stabilizing the market during periods of volatility
Generating profit primarily from the spread
Balancing the orderbook and maintaining market depth
Market Manipulator - a market participant who deliberately influences an asset's price to profit from price changes. Main strategies:
Self-Trading - creating an illusion of activity through transactions between related addresses; used to trade against copy traders (forcing them to copy losing trades)
Price-Setting - placing large orders without intending to fully execute them to create a false impression of supply/demand
Pump-and-Dump - sequential accumulation of tokens, artificial price increase, then mass selling at an inflated price
Spoofing - placing and quickly canceling large orders to create a false impression of market movement
Washing - creating the appearance of trading activity through self-deals without an actual change in ownership
Maker - a trader who places limit orders, thereby adding liquidity to the orderbook. Usually receives lower fees on exchanges.
Taker - a trader who executes existing orders in the book, thereby removing liquidity from the market. Usually pays higher fees.
Institutional Trader - a financial organization (bank, hedge fund, investment fund) trading in large volumes. Has significant resources, information, and can influence the market.
Retail Trader - an individual investor trading in relatively small volumes. Usually has limited resources and information.
Arbitrageur - a market participant who profits from price differences of the same asset on different markets or exchanges. Contributes to price efficiency.
Scalper - a trader who makes many short-term trades to get small profits from minor price movements. Often uses technical analysis and automated systems.
Whale - a market participant with extremely large funds who can significantly influence the price of an asset with their operations.
Liquidity and Volume
Liquidity - a measure of how easily an asset can be bought or sold without significantly affecting its price
Volume - the number of units of an asset traded during a specific period
Market Depth - the market's ability to absorb large orders without significant price changes
Price Levels
Support - a price level where demand is strong enough to prevent further price decline
Resistance - a price level where supply is strong enough to prevent further price increases
Price Gap - a sharp price change between two consecutive periods when there is no trading between them
Volatility and Trends
Volatility - a measure of an asset's price fluctuations
Trend - the general direction of an asset's price movement:
Uptrend - a series of rising highs and lows
Downtrend - a series of falling highs and lows
Sideways/Flat Trend - price moves in a horizontal range
Spreads and Quotes
Bid - the maximum price at which a trader is willing to buy an asset
Ask/Offer - the minimum price at which a trader is willing to sell an asset
Spread - the difference between bid and ask prices
Quote - the current price of an asset on an exchange
Mid Price - the average value between bid and ask prices
Risk Management
Risk-Reward Ratio - the ratio of potential profit to potential loss in a trade
Drawdown - the decline in portfolio value from peak to trough before a new peak
Position Sizing - determining the optimal number of asset units to trade considering risk
Diversification - distributing capital among various assets to reduce risk
Value at Risk (VaR) - a statistical measure of the maximum potential loss of a portfolio over a specific period with a given confidence level (e.g., a 95% VaR of 1000over1daymeansthereisa951000 within one day).
Hedging - using financial instruments or market strategies to reduce the risk of adverse price movements in an asset. An example is opening a short futures position to hedge a long spot asset position.
Stress Testing - an analysis method where a portfolio or strategy is evaluated under hypothetical extreme but plausible market scenarios (e.g., a sharp market crash, liquidity crisis) to understand potential losses and resilience.
Technical Aspects of Trading Systems
API and Integration
API (Application Programming Interface) - an interface allowing programmatic interaction with an exchange
Websocket - a protocol for receiving real-time data from an exchange
Rate Limit - the maximum number of API requests to an exchange over a specific period
Backtesting and Optimization
Backtesting - the process of testing a trading strategy on historical data
Optimization - the process of adjusting strategy parameters to improve results
Overfitting - excessive optimization of a strategy to historical data, which may lead to poor results in the real market
Algorithmic Trading
Algorithmic Trading - using computer algorithms to automatically execute trading operations
High-Frequency Trading - algorithmic trading with very high speed and a large number of trades
Latency - the time between sending an order and its execution on an exchange
Trading Types
Arbitrage - a strategy using price differences of the same asset on different exchanges or markets to obtain risk-free profit
Scalping - a short-term trading strategy aimed at making multiple small profits over short time intervals
Swing Trading - a medium-term strategy where positions are held from several days to several weeks
Position Trading - a long-term strategy where positions are held from several weeks to several months or even years
Trend Trading - using trends and recurring movements on price charts to analyze the general direction of assets
Day Trading - buying and selling assets within one trading day, positions are not carried over to the next day
Execution Algorithms - special algorithms for optimal execution of large orders (TWAP, VWAP, Iceberg)
Derivatives Trading
Futures Contracts
Perpetual Futures - a type of futures contract without an expiration date, which mimics the spot market but with the possibility of using leverage. The price is pegged to the spot price index through a funding rate mechanism.
Funding Rate - regular payments between holders of long and short positions in perpetual futures. If the rate is positive, longs pay shorts; if negative, shorts pay longs. This helps keep the futures price close to the spot price.
Initial Margin - the minimum amount of funds a trader must deposit to open a leveraged position. Calculated as a percentage of the total position size.
Maintenance Margin - the minimum margin level that must be maintained in an account after opening a position. If the account balance falls below this level, a margin call or liquidation occurs.
Liquidation - the forced closure of a trader's position by the exchange when their margin falls below the maintenance margin level. This is done to prevent further losses that could exceed the trader's account funds.
Options Contracts
Call Option - a contract giving the buyer the right (but not the obligation) to buy the underlying asset at a specified price (strike price) within a certain period or on a specific date (expiration date).
Put Option - a contract giving the buyer the right (but not the obligation) to sell the underlying asset at a specified price (strike price) within a certain period or on a specific date (expiration date).
Strike Price - the price at which the option holder can buy (for a call option) or sell (for a put option) the underlying asset.
Expiration Date - the date after which the option contract becomes invalid.
Greeks - a set of metrics used to measure various aspects of an option position's risk:
Delta - measures the sensitivity of an option's price to a $1 change in the price of the underlying asset.
Gamma - measures the rate of change of an option's delta as the price of the underlying asset changes.
Theta - measures the decrease in an option's value over time (time decay).
Vega - measures the sensitivity of an option's price to changes in the implied volatility of the underlying asset.
Market Microstructure Analysis
Order Flow - analysis of the sequence of orders entering the market
Orderbook Imbalance - the ratio of volumes on the buy and sell sides
Market Impact - price change resulting from the execution of a large order
Cluster Analysis - studying trading volumes at different price levels
Risk Management and Trading Psychology
Expected Return - the mathematical expectation of a trading strategy's result
Maximum Drawdown - the largest percentage decrease in capital from peak to trough
Sharpe Ratio - a measure of investment efficiency considering risk
Sortino Ratio - a risk-adjusted return ratio that considers drawdowns
Alpha Indicator - a measure of trading strategy effectiveness
Beta Indicator - a measure of trading strategy sensitivity to a market index
Calmar Ratio - the ratio of profit to maximum drawdown
Kelly Criterion - the optimal proportion of capital for trading
FOMO (Fear Of Missing Out) - an irrational fear of missing out on a potentially profitable opportunity, often leading to impulsive and ill-considered trades at price peaks.
FUD (Fear, Uncertainty, and Doubt) - the spread of negative, often unconfirmed information to cause panic and lower an asset's price for subsequent purchase at a lower price or to discredit a competitor.
Confirmation Bias - the tendency to search for, interpret, favor, and recall information in a way that confirms or supports one's preexisting beliefs or hypotheses.
Overconfidence - a cognitive bias in which a person's subjective confidence in their judgments and abilities is greater than their objective accuracy, which can lead to taking excessive risks.
Trading Journal - a systematic record of all trades and their analysis
Technical Aspects and Infrastructure
Colocation - placing trading servers in close proximity to exchange servers
Latency Arbitrage - utilizing the time difference in receiving market data
Network Infrastructure - optimizing network connections to minimize delays
Monitoring Systems - tools for tracking the operation of trading algorithms in real-time
Cryptocurrency-Specific Terms
DEX (Decentralized Exchange) - a decentralized exchange operating without a central intermediary
AMM (Automated Market Maker) - an automated market maker used in DEXs
Liquidity Pool - a pool of liquidity in decentralized protocols
Impermanent Loss - temporary value loss when providing liquidity in AMMs
DeFi (Decentralized Finance)
Yield Farming - the process of earning rewards (often in the form of additional tokens) for providing liquidity or staking cryptocurrencies in DeFi protocols.
Staking - the process of holding cryptocurrency in a wallet or on a special platform to support blockchain operations (e.g., validating transactions in Proof-of-Stake networks) and earn rewards.
Liquidity Mining - a type of yield farming where users receive protocol governance tokens in exchange for providing liquidity.
Wrapped Assets - tokens that represent an asset from another blockchain. For example, Wrapped Bitcoin (wBTC) is an ERC-20 token whose value is pegged to Bitcoin, allowing BTC to be used in the Ethereum DeFi ecosystem.
Oracles - services that supply smart contracts with real-world data (e.g., currency exchange rates, sports event outcomes) necessary for their correct operation.
Flash Loans - a special type of uncollateralized loans in DeFi that must be borrowed and repaid within a single blockchain transaction. Used for arbitrage, refinancing, and other complex operations.
MEV (Miner Extractable Value / Maximum Extractable Value) - the maximum value that miners (in Proof-of-Work networks) or validators (in Proof-of-Stake networks) can extract from block production beyond the standard block reward and transaction fees, by including, excluding, or reordering transactions within a block.
Tokenomics
Minting - the process of creating new tokens. This can occur according to a predefined algorithm (e.g., in Proof-of-Stake during staking) or by the decision of the project team.
Vesting - the process of gradually unlocking tokens distributed to the project team, advisors, or early investors. Usually occurs on a specific schedule to prevent a sharp drop in token price.
Token Burn - the process of permanently removing a certain number of tokens from circulation. Used to reduce the total supply of tokens, which can potentially increase their value.
Citation
@software{soloviov2025tradingterminology,
  author = {Soloviov, Eugen},
  title = {Trading System Terminology Dictionary},
  year = {2025},
  url = {https://marketmaker.cc/en/blog/post/trading-terminology},
  version = {0.1.0},
  description = {A comprehensive dictionary of trading system terms: from exchanges and pairs to metrics, signals, and risk management. Essential reference for algorithmic trading and research.}
}

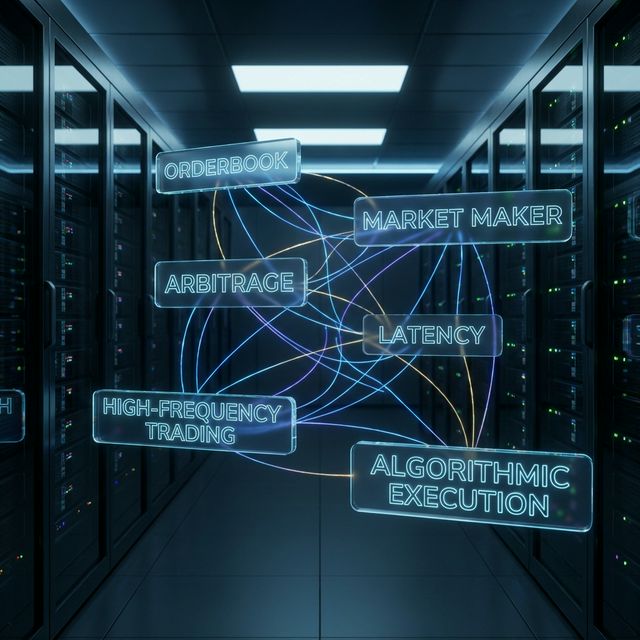 Algorithmic Core: A holographic glossary mapping the interconnected terminology of high-frequency quantitative systems.