뉴스레터를 구독하여 독점적인 AI 트레이딩 통찰력, 시장 분석 및 플랫폼 업데이트를 받아보세요.
Behavioral fingerprint of a trading algorithm: unique patterns of timing, sizing, and placement
Every algorithm leaves a unique fingerprint. Learn to read it — and you will know who is on the other side of your trade.
Introduction: The Order Book as a Crime Scene
When a forensic investigator arrives at a crime scene, they look for fingerprints, shoe prints, DNA — anything that links an event to a specific individual. The order book is a place where every second, hundreds of participants leave their "fingerprints": orders of a specific size, at a specific frequency, at a specific distance from the price, with a specific time-to-live.
On centralized exchanges (CEX), these fingerprints are anonymous — you only see aggregated volume at each price level. But even from aggregated data, you can learn a lot. And on DEX exchanges with an on-chain order book — such as Hyperliquid — each order is tied to a specific wallet address, and the "fingerprints" become personal.
In this article, we will explore how to build a system of "behavioral fingerprints" for identifying participant types and specific market maker algorithms.
Part 1: What Is a Behavioral Fingerprint
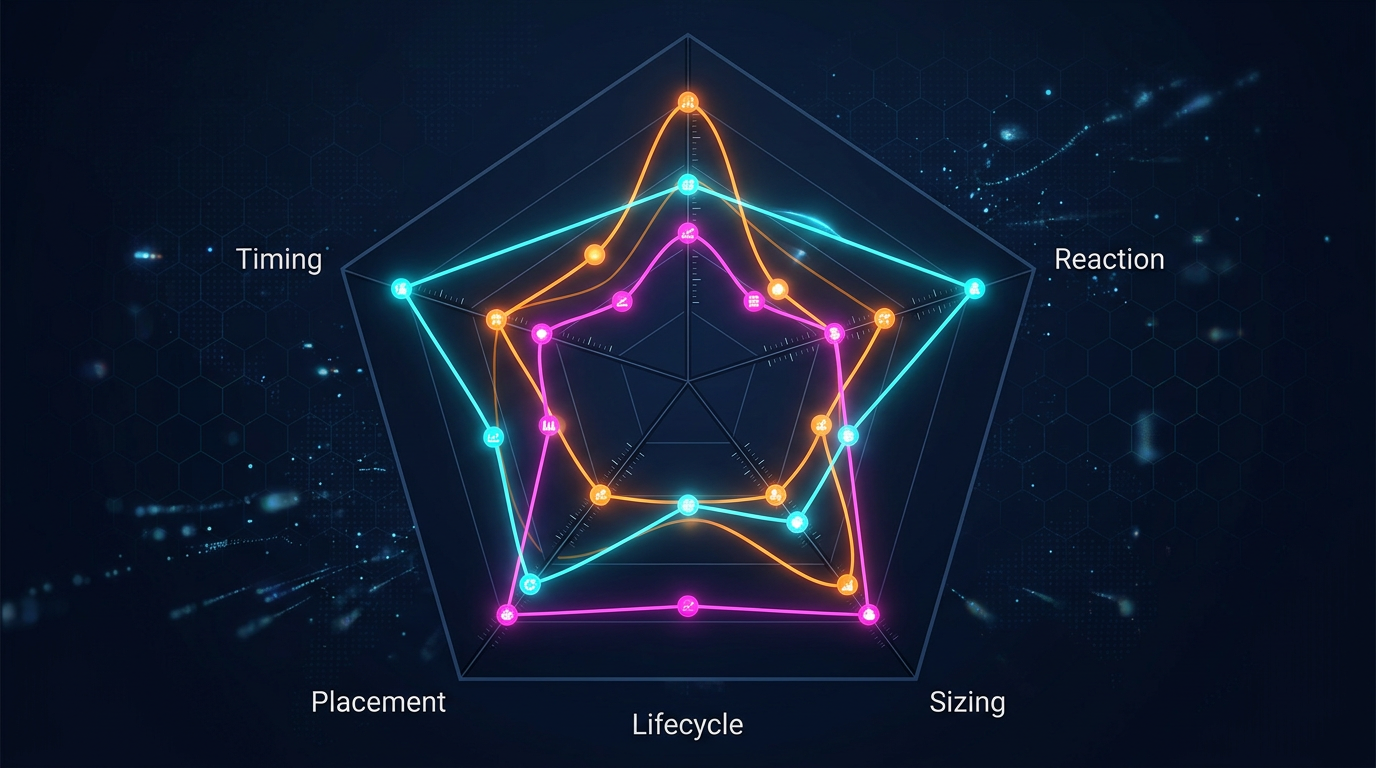
Radar chart: five key dimensions of a trader's behavioral fingerprint
Every Algorithm Is a Set of Rules
A market-making bot is a program that makes decisions based on rigid (or learned) rules:
How far from mid-price should orders be placed? Every MM has its own "spread profile."
What size? Round lots (100, 500, 1000)? Random numbers? Fixed size with ±5% noise?
How often should quotes be updated? Every 50ms? Only when mid-price changes? On a timer?
How to react to fills? Instant re-quoting? Pause? Shifting the remaining side?
How to react to volatility? Spread widening? Quote pulling? Size reduction?
How to manage inventory? Quote skewing when accumulating a position?
Each set of answers to these questions is a unique "signature" of the algorithm.
Five Dimensions of the Fingerprint
┌─────────────────────────────────────────────────────────────────┐
│              DIGITAL FINGERPRINT OF A TRADER                    │
│                                                                 │
│  1. TIMING       │  Inter-order intervals, reaction             │
│                  │  to events, circadian patterns               │
│──────────────────┼─────────────────────────────────────────────  │
│  2. SIZING       │  Order size distribution,                    │
│                  │  round-lot ratio, dispersion                  │
│──────────────────┼─────────────────────────────────────────────  │
│  3. PLACEMENT    │  Distance from mid-price,                    │
│                  │  bid/ask symmetry, level anchoring            │
│──────────────────┼─────────────────────────────────────────────  │
│  4. REACTION     │  Response to fills, cancels, price jumps,    │
│                  │  volatility changes                           │
│──────────────────┼─────────────────────────────────────────────  │
│  5. LIFECYCLE    │  Average order lifetime,                     │
│                  │  cancel conditions, modify vs cancel+new      │
│──────────────────┴─────────────────────────────────────────────  │
└─────────────────────────────────────────────────────────────────┘
Part 2: Feature Extraction
Self-exciting Hawkes process: event clusters with exponential decay
Timing: When and How Often
The timing pattern is the hardest element of the fingerprint to fake. It is determined by the algorithm's architecture, network latency, hardware, and even the developers' time zone.
Key metrics:
Inter-order interval (IOI) — the time between consecutive orders from the same participant. For an HFT bot, IOI = 50–500 microseconds. For a manual trader — seconds to minutes.
Reaction time to trade — the delay between an order fill and the next action. Reflects the bot's internal architecture.
Circadian pattern — the daily activity profile. An institutional MM operates during trading sessions. A crypto bot runs 24/7.
Self-excitation (Hawkes intensity) — how strongly a current order "triggers" the next one. Market makers exhibit strong self-excitation.
For modeling timing patterns, Hawkes processes — self-exciting point processes — are ideal. The Hawkes process parameters (base intensity μ, excitation coefficient α, decay rate β) form a compact "chronological fingerprint" of a participant.
Sizing: How Much and How
Size distribution — the distribution of order sizes. Professional MMs often use round lots with noise: 100 ± 5, 500 ± 10.
Size-depth correlation — does the order size depend on the current depth of the book?
Bid-ask size asymmetry — the ratio of sizes on bid and ask. The skew pattern is the "handwriting" of inventory management.
Size autocorrelation — repeatability of sizes over time.
Placement: Where in the Book
Spread offset — distance from mid-price in ticks or bps
Level preference — anchoring to specific levels (round numbers?)
Quoting symmetry — how symmetric are the bid and ask orders
Multi-level footprint — how many levels are quoted simultaneously
Reaction: How It Responds to Events
Post-fill behavior — what happens after an order is filled
Volatility response — how behavior changes when volatility increases
Quote-to-trade ratio (QTR) — the ratio of order updates to fills
Adverse selection response — reaction to price movement against the position
Lifecycle: The Order's Life Cycle
Order lifetime distribution — average order time-to-live
Modify vs Cancel+New — does it update via modify or cancel+new?
Cancel clustering — does it cancel one by one or in batches?
Part 3: Participant Classification
Taxonomy of market participants: market makers, HFT, opportunistic, fundamental, and noise traders
Taxonomy of Market Participants
Based on behavioral features, participants can be classified into stable categories. Research by the CFTC (Kirilenko et al., 2011):
1. Market Makers
Two-sided quotes (bid + ask) for >80% of the time
Zero or near-zero net position by end of day
High QTR (>100:1)
React to volatility by widening spreads
2. High-Frequency Traders (HFT)
Ultra-high message rate (>1000 events/minute)
Very short holding period (seconds)
Sub-millisecond reaction times
3. Opportunistic Traders
Moderate frequency
React to specific market conditions
Irregular timing, clustered around events
4. Fundamental Traders
Accumulate long-term positions
Low frequency, large order sizes
TWAP/VWAP algorithms for execution
5. Noise Traders (Retail)
Small sizes, irregular timing
Reactive: trade after price moves, not before
Market orders at peak volatility
Classification Methods
Supervised Learning: For DEX data (Hyperliquid), a training set can be assembled from addresses of known market makers. RNN models achieve accuracy >85%.
Unsupervised Learning:
Spectral Clustering (Cont et al., 2023) — clustering by order flow pattern similarity matrix
Address cluster graph: one operator — multiple wallets, grouped by behavioral similarity
On Hyperliquid, a single market maker can operate through dozens or hundreds of addresses.
Clustering algorithm:
For each active address — build a fingerprint vector over a window of N hours
Hierarchical clustering — merge addresses with distance < threshold
Temporal validation — verify cluster stability over time
Cross-pair validation — if two addresses trade different pairs but fingerprints match — strong signal
Cluster #7 (suspected: Wintermute)
├── 0x3a1f...2e8c  — BTC/USDT, 45% of activity
├── 0x7b2d...9f1a  — ETH/USDT, 30% of activity
├── 0xc4e8...5d3b  — SOL/USDT, 15% of activity
└── 0x91fa...0c7e  — ARB/USDT, 10% of activity

Common pattern: symmetric quoting, 5 levels, median_IOI=240ms,
median_size=500±8%, batch cancel 60%, presence 95%
Part 5: Manipulation Scenarios and Their Fingerprints
Spoofing: The Fingerprint of a Fake Wall
Spoofer fingerprint:
  cancel_rate:         > 95%
  lifetime:            < 2 seconds
  placement:           1-3 ticks from mid-price
  size:                anomalously large (>10x median depth)
  reaction_to_approach: cancel when price approaches
  cyclicity:           repeats >3 times / minute
Squeeze: The Liquidity Trap
Four phases: quiet accumulation, liquidity removal, stop-order cascade, profit taking. Real-time detection is possible by identifying the transition from Phase 1 to Phase 2.
Iceberg / Hidden Accumulation: The Silent Build-Up
Hidden accumulation fingerprint:
  visible_size:        small (10-50 lots)
  refill_speed:        instant (< 100ms after fill)
  refill_count:        > 20 at a single level per session
  price_reaction:      price does not move despite volume
Wash Trading: Self-Dealing
Two or more addresses from the same cluster simultaneously sit on bid and ask and execute against each other. Purpose: inflating volume.
Regime switching — a single bot can change behavior depending on the market regime
False positives — two participants may coincidentally share similar parameters
CEX opacity — L3 data is unavailable on CEX
Conclusion: From Reading the Book to Reading the Participants
A traditional trader sees: 2,400 lots at the 10000 level. An advanced trader sees: "my order is 1,800th in the queue, ETA — 15 seconds." But a trader with behavioral fingerprinting sees:
"800 of those 2,400 are a market maker (likely Wintermute), the wall is solid. 500 are suspected spoofs, the real queue ahead of me is 1,300, not 1,800. Adjusted ETA — 10 seconds. The market maker isn't pulling quotes — so no large move is expected for now."
Each new layer of information is an edge. And unlike speed, the quality of order book interpretation is a domain where a retail trader can compete.
At Marketmaker.cc, we are building this system — from queue position to behavioral fingerprinting — as a unified product.


 Radar chart: five key dimensions of a trader's behavioral fingerprint
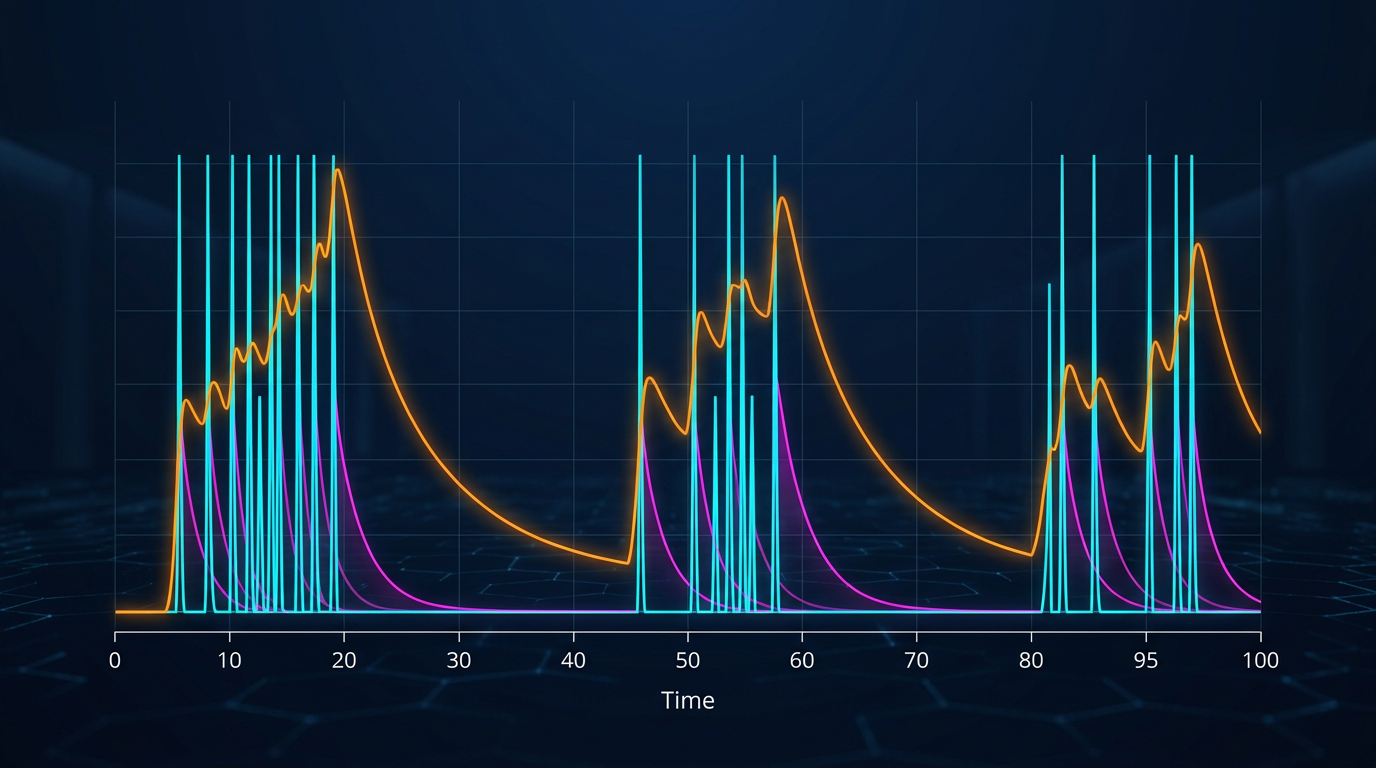 Self-exciting Hawkes process: event clusters with exponential decay
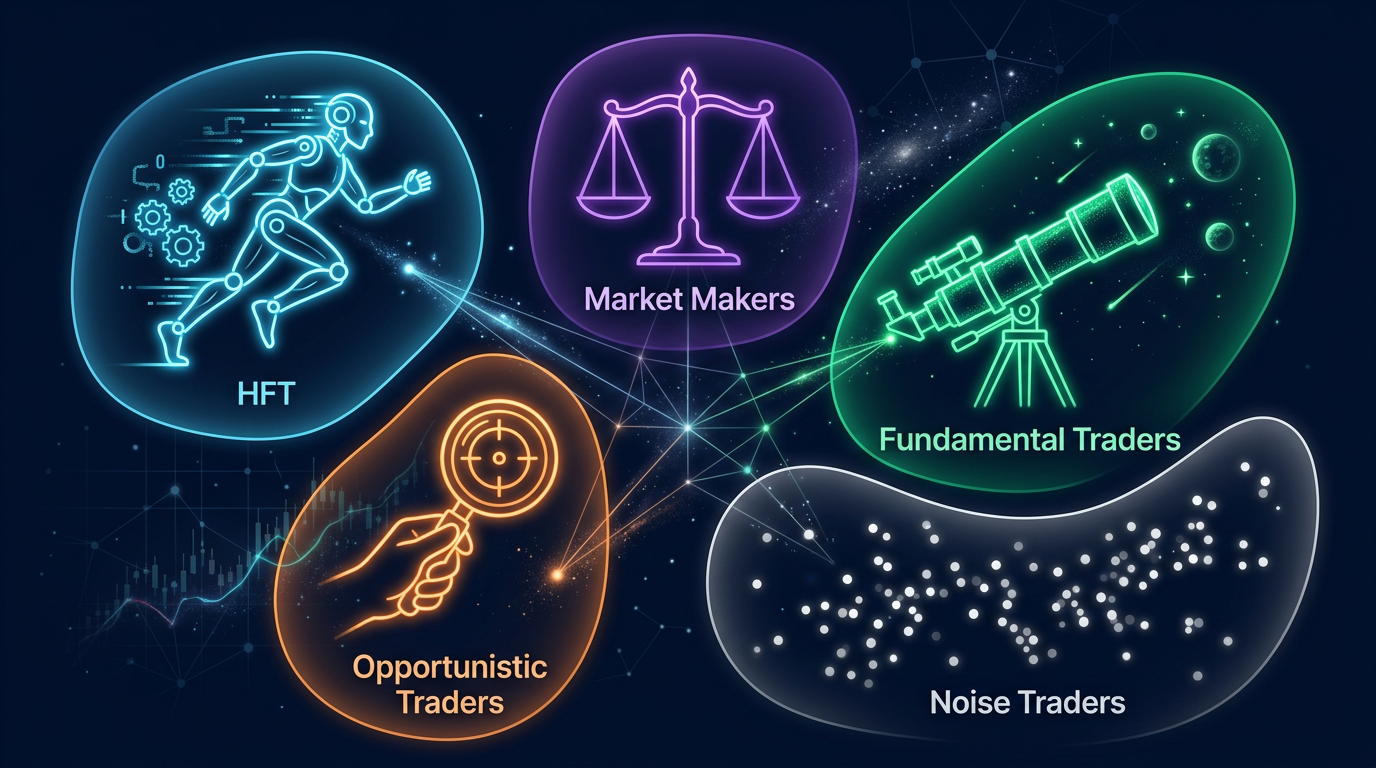 Taxonomy of market participants: market makers, HFT, opportunistic, fundamental, and noise traders
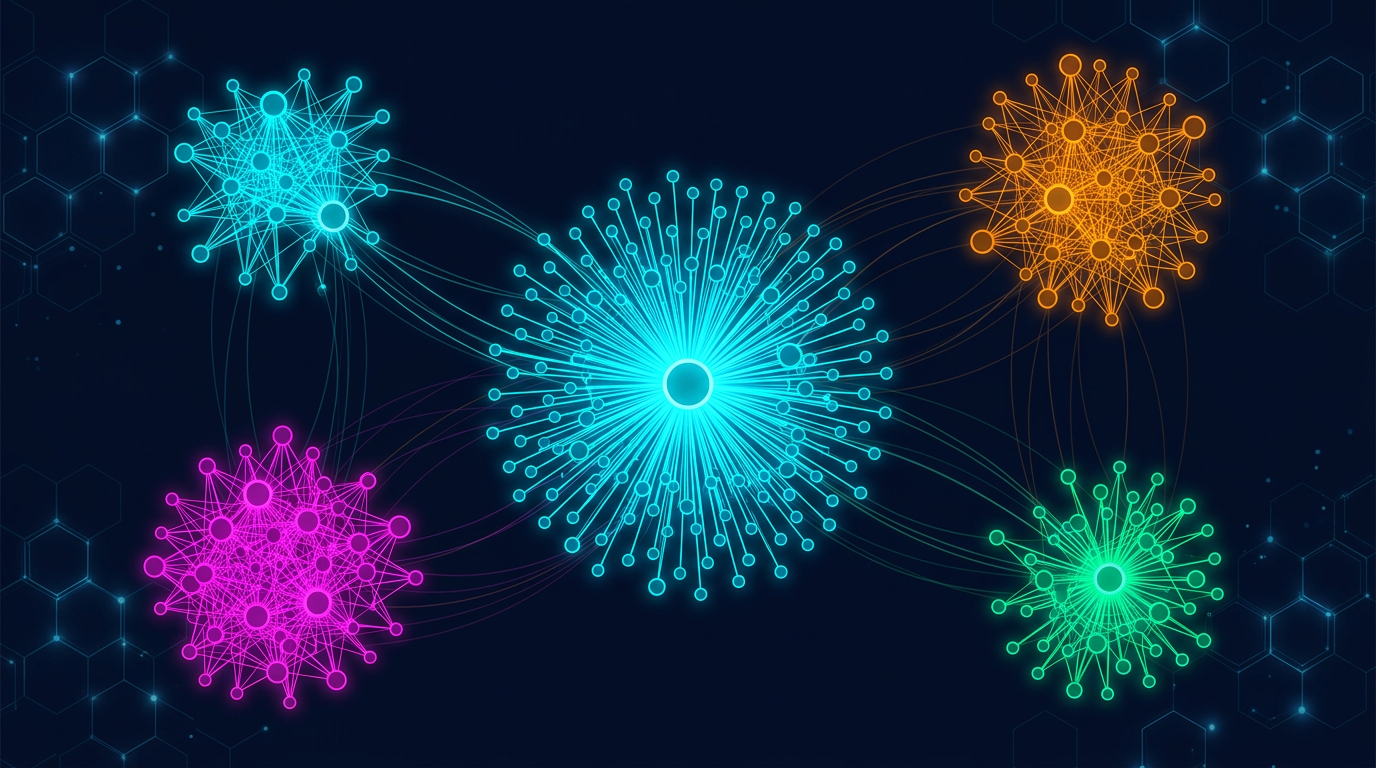 Address cluster graph: one operator — multiple wallets, grouped by behavioral similarity