뉴스레터를 구독하여 독점적인 AI 트레이딩 통찰력, 시장 분석 및 플랫폼 업데이트를 받아보세요.
Imagine this: you drop a marble into a funnel. No matter where you drop it, it always rolls to the center. That center is the attractor—a point of convergence for all possible trajectories. Now imagine that financial markets work in a similar way, but instead of marbles, we have asset prices, and instead of a funnel, we have complex mathematical patterns. Welcome to the world of attractors in high-frequency trading!
What is an Attractor and Why Does a Trader Need It?
An attractor is a compact subset of the phase space of a dynamical system, to which all trajectories from a certain neighborhood tend as time approaches infinity[1][7]. Sounds intimidating? In reality, it's simple: it's a point or region that the system is "pulled" toward like a magnet[8][16].
Attractors are everywhere in the real world. A pendulum with friction will eventually stop at its lowest point—that's its attractor[1][7]. Water in a bathtub always drains to the plughole, no matter how many swirls you create on the surface. Even human behavior has its own attractors—habits we return to again and again.
In financial markets, attractors appear as certain prices or recurring patterns to which the market returns repeatedly[8][16]. For example, the equilibrium price acts as an attractor, pulling the current price toward itself[10]. This explains why stock prices don't fly off to infinity but oscillate around certain levels.
Theoretical Foundations: From Simple to Complex
Conceptual diagram showing Point Attractors, Limit Cycles, and Strange Attractors in a dynamical system
There are different types of attractors. The simplest is a point attractor. This is the classic pendulum example: the system eventually settles at a single point[1][3]. In trading, such an attractor may correspond to the fair value of an asset calculated from fundamentals.
A more interesting case is the limit cycle. The system doesn't stop at a single point but moves cyclically along a closed trajectory[3]. In markets, this can correspond to seasonal price fluctuations or technical support and resistance levels.
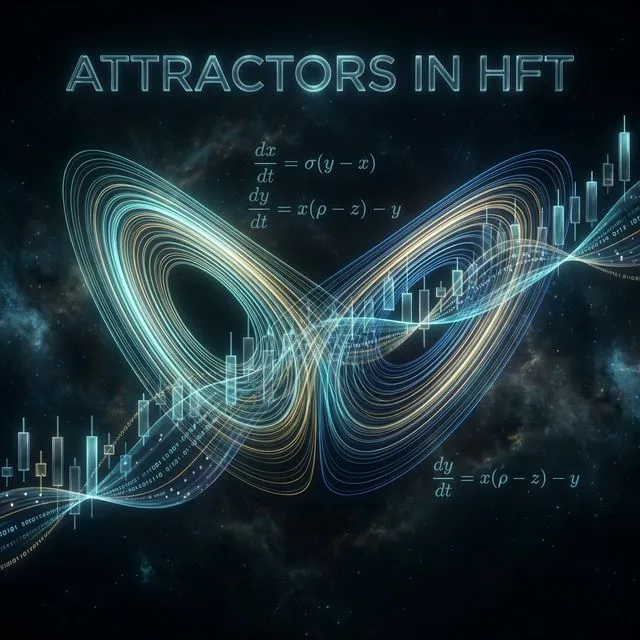
But the most fascinating are strange attractors. They look complex and can reveal hidden order in the seemingly random behavior of the market[8][16]. The structure of a strange attractor is fractal; the trajectories are aperiodic but remain within a bounded region of space[7]. The classic example is the Lorenz attractor, which describes chaotic behavior in deterministic systems[1][17].
Edward Lorenz, the founder of chaos theory, discovered that tiny changes in initial conditions lead to dramatically different outcomes—the famous "butterfly effect"[17]. In financial markets, this means that minor events can trigger unpredictable price jumps[17].
Visualizing the 'Butterfly Effect': how minor local fluctuations can trigger massive global market movements
Attractors in Financial Markets
In the context of financial markets, attractors manifest at different time scales and in various forms. At the high-frequency level, they are motivated by arbitrage arguments—the law of one price implies that identical assets should trade at the same price to avoid arbitrage opportunities[15]. This creates attractors between the prices of the same asset traded on different markets.
At lower frequencies, attractors are linked to economic theories that imply equilibrium relationships between time series variables[15]. The permanent income model implies cointegration between consumption and income; money demand models imply cointegration between money, income, prices, and interest rates[15].
Market behavior during crises is especially interesting. As one trader notes, "the price always moves toward an equilibrium state, and there are many of them"[10]. An equilibrium state can be defined as a price at which the number of market orders is less than or equal to the number of limit orders[10]. Thus, the equilibrium price pulls the current price toward itself, acting as an attractor[10].
Cointegration as a Practical Manifestation of Attractors
Here we come to the key link between attractors and cointegration. Cointegration describes a long-term relationship between two or more asset prices[6]. When two assets are cointegrated, they share common stochastic trends, and their prices move together[6].
The prices of cointegrated assets are linked due to the stationarity of the spread[6]. This means the spread between prices does not tend to grow or fall without bound but fluctuates around a certain mean. In essence, this mean is the attractor for the spread.
Cointegration in pairs trading: two related asset prices orbiting a common long-term equilibrium path (the attractor)
Let's look at a practical example. Take a pair of cointegrated stocks, A and B. The spread between them is calculated as: Spread = P_A - γ*P_B, where γ is the cointegration coefficient[4][20]. This spread tends to be stationary, i.e., it has a constant mean and limited variance[4][20].
When the spread deviates from its mean (the attractor), a trading opportunity arises. If the spread is too large, we can sell asset A and buy asset B, expecting the spread to revert to the mean. Conversely, if the spread is too small or negative, we do the opposite[4][9].
Application in Algorithmic Trading
Modern algorithmic trading actively uses the concept of attractors to build trading strategies[2]. Algorithms can monitor market data, identify patterns, and execute orders much more efficiently than any human could[2].
The company Algoter, specializing in quantitative trading, combines machine learning, real-time data analysis, and deep market understanding in its flagship product Goldseek to develop strategies that adapt to changing market dynamics[2]. Instead of reacting to the market, these systems aim to anticipate it, helping investors stay ahead of volatility and opportunities[2].
With the development of artificial intelligence and reinforcement learning, the next generation of trading systems can learn from past data, adjust strategies on the fly, and even recognize new market regimes before they fully form[2].
Pairs trading is one of the most popular strategies based on the concept of attractors[9][14]. This is a market-neutral trading strategy that allows traders to profit in almost any market condition: uptrend, downtrend, or sideways movement[14].
The strategy tracks the performance of two historically correlated securities. When the correlation between the two temporarily weakens—one stock rises while the other falls—pairs trading involves selling the outperforming stock and buying the underperformer, betting that the "spread" between them will eventually converge[14].
Practical Trading Strategies
Let's consider a concrete implementation of an attractor-based strategy. For example, take a pair of stocks (VSYDP, NKHP) that demonstrate cointegration[4].
Step 1: Parameter Determination
Use the first half of the observations to determine the parameters of the trading strategy. Calculate the cointegration coefficient γ and determine the average spread level (our attractor)[4].
Step 2: Signal Generation
Set thresholds for deviation from the attractor. Standard deviations of the spread are usually used. When the spread deviates from the mean by 2 standard deviations in either direction, a trading signal is generated[4].
Step 3: Trade Execution
If the spread is below the lower threshold, buy stock A and sell stock B in a 1:γ ratio. When the spread returns to the mean (the attractor), close the position[4].
Step 4: Risk Management
Set a stop-loss in case the spread starts trending instead of reverting to the mean. This can happen due to structural changes in the relationship between the assets[14].
Such strategies are automated using specialized systems. For example, the TradeHelp robot offers a "Cointegration Scoring" feature, which calculates cointegration using the Johansen test for arbitrage baskets of two or more securities[18].
Advanced Methods and Multidimensional Attractors
Multidimensional system (Johansen test): a basket of assets simultaneously gravitating toward a common complex attractor
Modern approaches are not limited to pairs trading. The Johansen test allows working with multidimensional systems where several assets simultaneously tend toward a common attractor[18]. This significantly reduces arbitrage risks and increases strategy stability[18].
When calculating cointegration coefficients (weights of securities in the basket), not only the amount of money per security is taken into account, but also its volatility[18]. The basis of basket arbitrage does not have a pronounced trend, which increases the probability of the basis returning to the mean and generating profit[18].
It is also important to understand the difference between high-frequency and low-frequency cointegration. High-frequency cointegration is motivated by arbitrage arguments and is usually associated with technical trading factors[15]. Low-frequency cointegration is based on long-term economic relationships and can persist for years[15].
Limitations and Risks of Attractor-Based Strategies
Despite the appeal of the attractor concept, trading based on it is not without risks. The main difficulty arises when the prices of two securities start to diverge—the spread starts trending instead of reverting to the original mean[14].
Drift is one of the main risks. When mean values change, this is sometimes called "drift"[14]. The attractor can shift to a new position, and the old trading model stops working. To counter this, strict risk management rules are required, forcing the trader to exit a losing trade as soon as the original premise—the bet on mean reversion—becomes invalid[14].
Model risks are also significant. Market-neutral strategies assume that the CAPM model is valid and that beta is a correct estimate of systematic risk—if not, your hedge may not protect you properly when markets shift[14].
The butterfly effect in financial systems means that even the smallest changes at the start can lead to large and unexpected consequences[8][17]. The slightest changes in input data or the model can greatly alter forecasts, making long-term prediction difficult[8].
Technical Aspects of Implementation
Practical implementation of attractor-based strategies requires serious technical preparation. Modern systems use R or Python for statistical calculations[18]. Algorithms must operate in real time, processing large volumes of market data.
Key technical components include:
Data collection system — for obtaining real-time quotes and historical data for backtesting.
Statistical analysis module — for calculating cointegration, identifying attractors, and generating trading signals.
Risk management system — for controlling position size, setting stop-losses, and monitoring overall portfolio risk.
Order execution module — for automatic placement and management of trading orders.
Low latency is also critical. In high-frequency trading, speed of reaction allows traders to take advantage of narrower spreads[14].
Conclusion: The Future of Attractors in Trading
The concept of attractors in algorithmic trading is a powerful tool for understanding and predicting market behavior. Cointegration is the practical embodiment of attractors in financial markets, where spreads between related assets tend toward equilibrium values.
Modern machine learning and AI technologies open up new opportunities for detecting hidden attractors in market data[2]. Systems are becoming capable not only of following pre-programmed rules but also of constantly improving in response to market feedback[2].
However, it is important to remember that financial markets are complex adaptive systems where participant behavior is constantly evolving. Attractors can shift, disappear, or appear in new places. Successful attractor-based trading requires not only understanding mathematical principles but also constant adaptation to changing market conditions.
Ultimately, attractors in HFT are not a magic formula for guaranteed profit, but a tool for better understanding market dynamics. Like any tool, it requires skillful application, continuous improvement, and healthy skepticism toward one's own models.
Citation
@article{soloviov2025attractorsalgotrading,
  author = {Soloviov, Eugen},n  title = {Attractors in HFT: When Mathematics Meets the Market},
  year = {2025},
  url = {https://marketmaker.cc/en/blog/post/attractors-algotrading},
  version = {0.1.0},
  description = {How the concept of attractors and cointegration helps build market-neutral strategies and understand market dynamics.}
}


 Conceptual diagram showing Point Attractors, Limit Cycles, and Strange Attractors in a dynamical system
 Visualizing the 'Butterfly Effect': how minor local fluctuations can trigger massive global market movements
 Cointegration in pairs trading: two related asset prices orbiting a common long-term equilibrium path (the attractor)
 Multidimensional system (Johansen test): a basket of assets simultaneously gravitating toward a common complex attractor