Today, let's break down one of the most underrated yet extremely useful tools in technical analysis — Bill Williams fractals. If you think this is something from advanced mathematics, rest assured: it's much simpler and more practical than it sounds.
What Are Fractals and What Do They Have to Do with Trading?
Bill Williams is the guy who gave us a bunch of useful indicators, including the famous Alligator[2]. But fractals are his special pride and the first dimension of his trading system[9].
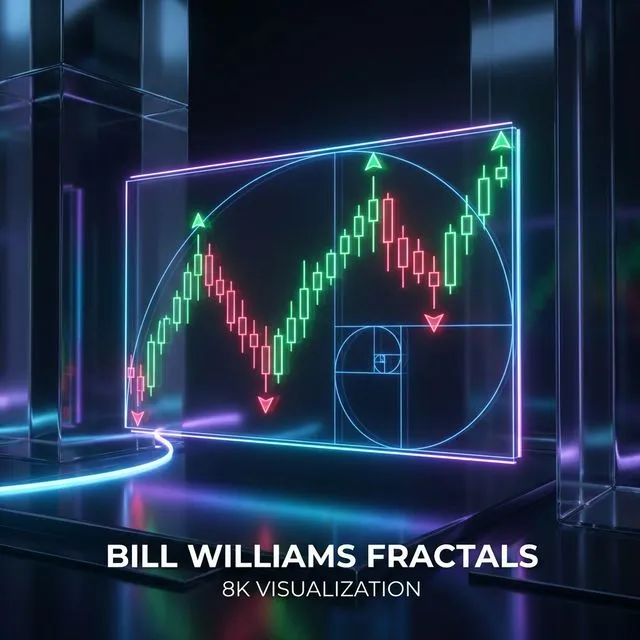
A fractal in trading is simply a local extremum on the price chart. Imagine a little hill or dip on the chart — that's a fractal[6]. On the chart, they're shown as arrows: up for highs, down for lows[5].
A classic fractal consists of five bars, with the middle one having the highest high (up fractal) or the lowest low (down fractal)[2]. Although Williams himself said five bars aren't strictly required, this combination became the standard in MetaTrader 4[6].
Anatomy of a fractal: the central bar acts as a local extreme, surrounded by lower highs or higher lows
How It Works in Practice
The logic of fractals is almost laughably simple:
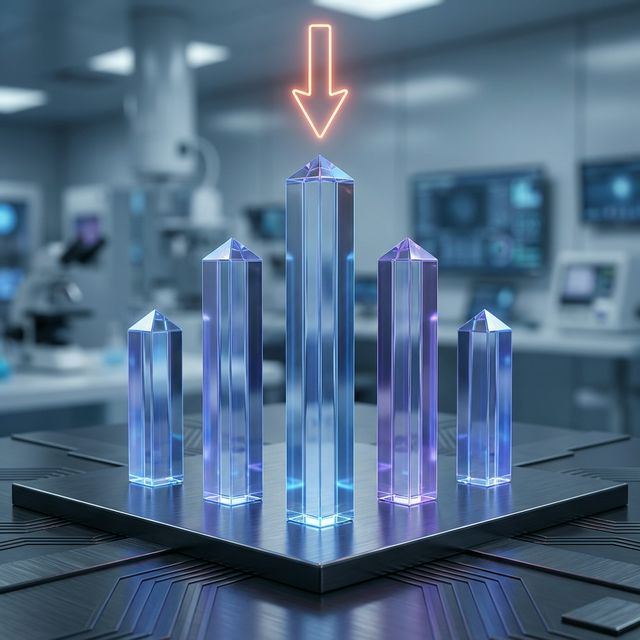
Up fractal (up arrow) — a potential resistance level. When price breaks above it, that's a buy signal[5].
Down fractal (down arrow) — a potential support level. A break below gives a sell signal[5].
Trading signals: a breakout above an up fractal indicates potential trend continuation or resistance breach
But here's the catch! A fractal only forms after the last bar in the pattern closes. So the signal always comes with a delay — that's the price for reliability[8].
Why Fractals Work
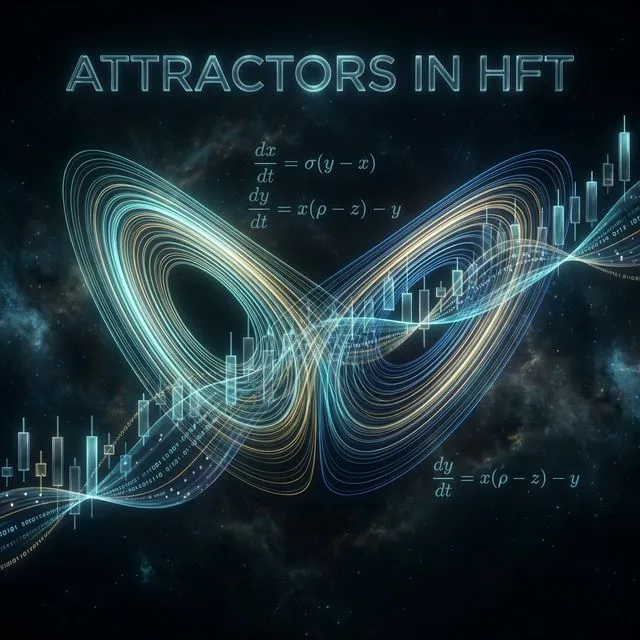
The key is that the market has a fractal nature — the same patterns repeat on different timeframes[4]. It's like a matryoshka doll: inside a big move are smaller ones, and inside those, even smaller ones.
The 'Matryoshka' effect in financial markets: patterns at larger scales are composed of similar patterns at smaller scales
Williams applied the principles of chaos and fractal geometry to financial markets[7]. Sounds smart, works simply.
Trading System: Fractals + Alligator
Williams never recommended trading on fractals alone. His signature move is the combination of fractals with the Alligator indicator[2].
Conceptual visualization of the Alligator indicator: Jaw (blue), Teeth (red), and Lips (green) working in harmony with fractals
The rules are simple:
Buy on an up fractal breakout if it's above the Alligator's "teeth" (the red line)[9]
Sell on a down fractal breakout if it's below the Alligator's "teeth"[9]
This filter removes many false signals and increases the win rate.
Practical Tips
Stop-losses should be placed behind the nearest opposite fractal[10]. If you buy on an up fractal breakout, place your stop behind the last down fractal.
Take-profits can be set at the next fractal levels or managed with a trailing stop.
Fractals work great for building support and resistance levels[5]. You can also use them to stretch Fibonacci grids between local extremes[3].
Pitfalls
The main problem with fractals is signal lag. By the time a fractal forms, the move may already be over.
The second issue is lots of false breakouts, especially on lower timeframes. That's why filtering with the Alligator or other indicators is not a luxury, but a necessity.
Conclusion
Williams fractals aren't a magic wand, but they're a solid tool for identifying key levels and reversal points. Combined with other indicators, they can form the basis of a profitable trading system.
The main thing to remember: any tool is only as good as the hands that use it. Test, practice, and never forget about risk management!


 Anatomy of a fractal: the central bar acts as a local extreme, surrounded by lower highs or higher lows
 Trading signals: a breakout above an up fractal indicates potential trend continuation or resistance breach
 The 'Matryoshka' effect in financial markets: patterns at larger scales are composed of similar patterns at smaller scales
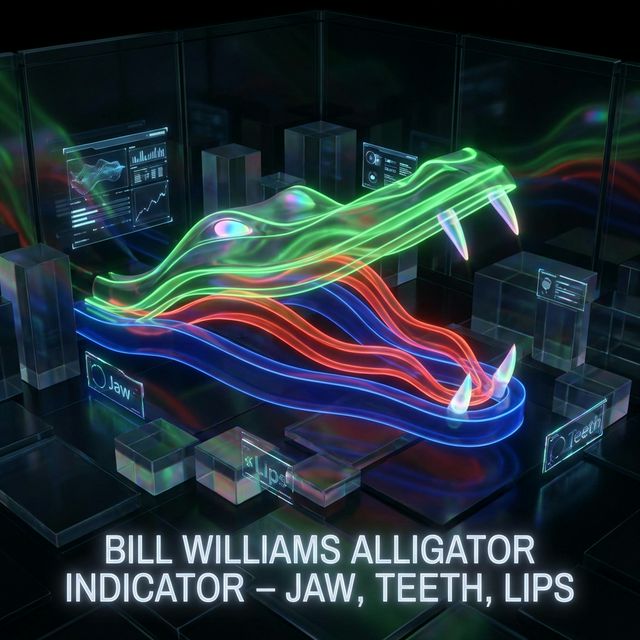 Conceptual visualization of the Alligator indicator: Jaw (blue), Teeth (red), and Lips (green) working in harmony with fractals